FAST: Dividend Analysis - Fastenal Company
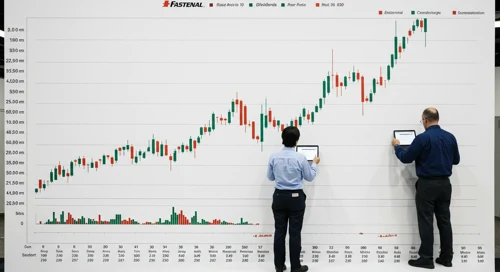
FAST: In-depth analysis of a company's dividend stability and key fundamental ratios to assess its financial strength and long-term investment potential.
May 29, 2026 a 03:31 pm
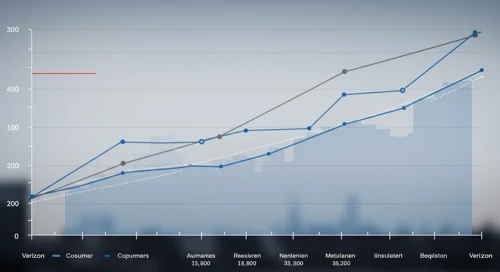
Europe Comparison. 29 May

Comparison of Europe. Where is strength and weakness? What has developed well and badly?
May 29, 2026 a 03:31 pm
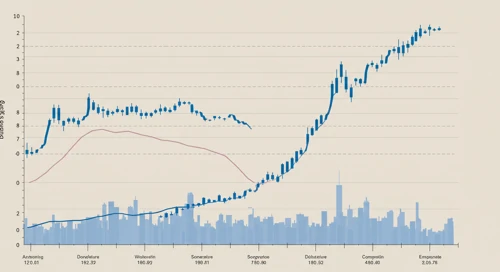
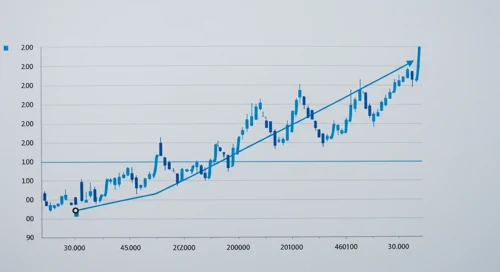
VZ: Fibunacci Level Technical Analysis - Verizon Communications Inc
VZ: Fibonacci retracement levels to identify key potential support and resistance zones, based on recent price trends.
May 29, 2026 a 03:15 pm
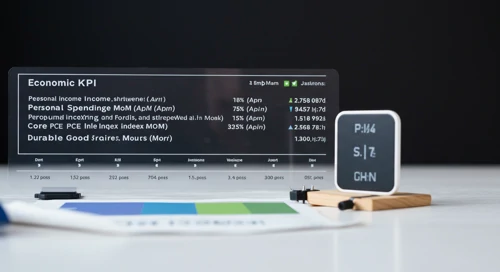
Todays Important Key Figures 29 May

Today’s important economic data releases – a snapshot of key indicators influencing markets and shaping financial expectations.
May 29, 2026 a 03:00 pm
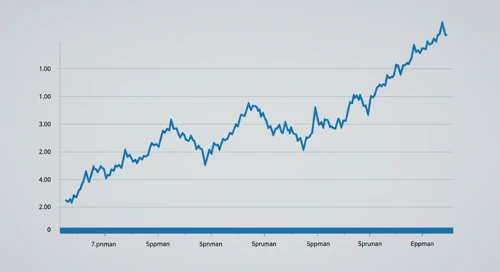
EVRG: Trend with Support and Resistance Levels - Evergy Inc

EVRG: Current price trend is evaluated alongside key support and resistance level. View of potential turning points and price momentum.
May 29, 2026 a 02:03 pm
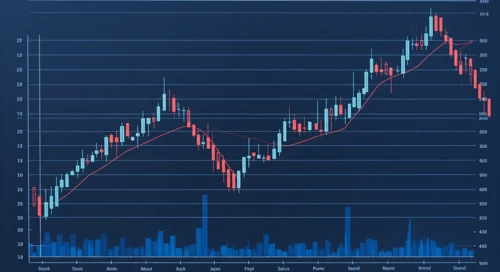
MU: Trend with Support and Resistance Levels - Micron Technology Inc
MU: Current price trend is evaluated alongside key support and resistance level. View of potential turning points and price momentum.
May 29, 2026 a 01:15 pm
PYPL: Analysts Ratings - PayPal Holdings Inc

PYPL: Comprehensive breakdown of current and historical analyst ratings, offering insights into how expert sentiment has evolved over time.
May 29, 2026 a 01:00 pm

LYV: Analysts Ratings - Live Nation Entertainment Inc
May 29, 2026 a 05:00 pm
EG: Fibunacci Level Technical Analysis - Everest Re Group Ltd
May 29, 2026 a 04:44 pm
AZO: Analysts Ratings - AutoZone Inc
May 29, 2026 a 04:38 pm
BXP: Fundamental Ratio Analysis - BXP Inc
May 29, 2026 a 03:43 pm
COIN: Fundamental Ratio Analysis - Coinbase Global Inc

COIN: Evaluation of key financial ratios, analyst ratings, and price targets. A data-driven perspective on the valuation and market expectations.
May 29, 2026 a 01:00 pm
EQIX: Dividend Analysis - Equinix Inc

EQIX: In-depth analysis of a company's dividend stability and key fundamental ratios to assess its financial strength and long-term investment potential.
May 29, 2026 a 12:46 pm
NTAP: Analysts Ratings - NetApp Inc
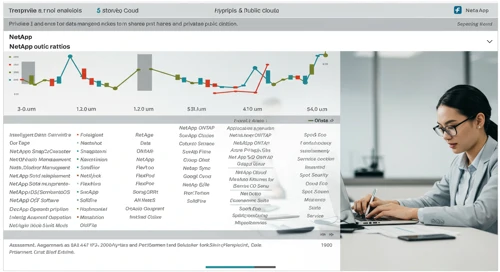
NTAP: Comprehensive breakdown of current and historical analyst ratings, offering insights into how expert sentiment has evolved over time.
May 29, 2026 a 12:38 pm
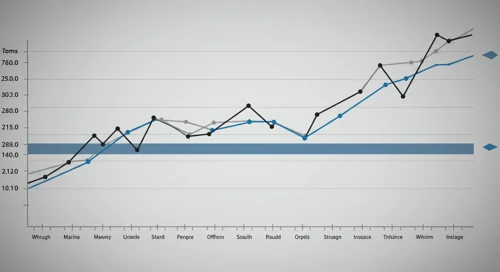
Major Indices Comparison. 29 May
Comparison of Major Indices. Where is strength and weakness? What has developed well and badly?
May 29, 2026 a 12:31 pm
APP: Fibunacci Level Technical Analysis - AppLovin Corporation
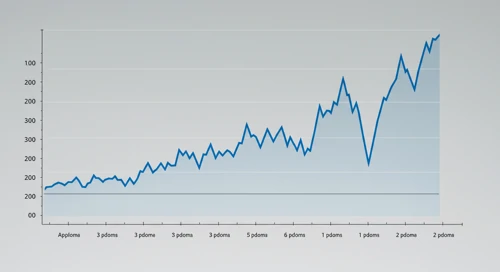
APP: Fibonacci retracement levels to identify key potential support and resistance zones, based on recent price trends.
May 29, 2026 a 11:44 am
CAT: Fundamental Ratio Analysis - Caterpillar Inc
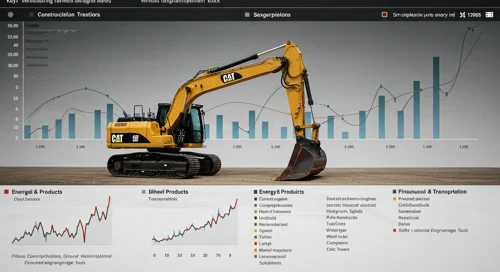
CAT: Evaluation of key financial ratios, analyst ratings, and price targets. A data-driven perspective on the valuation and market expectations.
May 29, 2026 a 11:43 am
KKR: Fibunacci Level Technical Analysis - KKR and Co Inc
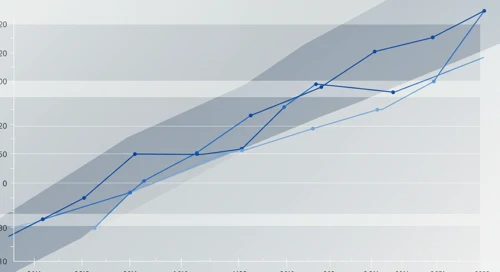
KKR: Fibonacci retracement levels to identify key potential support and resistance zones, based on recent price trends.
May 29, 2026 a 10:15 am
Stock Market - Heatmap
Use mouse wheel to zoom in and out. Click a ticker to display detailed information in a new window. Hover mouse cursor over a ticker to see more data.
Stock's
SYK: Fundamental Ratio Analysis - Stryker Corporation

SYK: Evaluation of key financial ratios, analyst ratings, and price targets. A data-driven perspective on the valuation and market expectations.
May 29, 2026 a 08:00 am
ELV: Dividend Analysis - Elevance Health Inc

ELV: In-depth analysis of a company's dividend stability and key fundamental ratios to assess its financial strength and long-term investment potential.
May 29, 2026 a 07:46 am
CSGP: Fundamental Ratio Analysis - CoStar Group Inc

CSGP: Evaluation of key financial ratios, analyst ratings, and price targets. A data-driven perspective on the valuation and market expectations.
May 29, 2026 a 07:43 am
EMR: Dividend Analysis - Emerson Electric Co

EMR: In-depth analysis of a company's dividend stability and key fundamental ratios to assess its financial strength and long-term investment potential.
May 29, 2026 a 07:31 am
STZ: Fibunacci Level Technical Analysis - Constellation Brands Inc
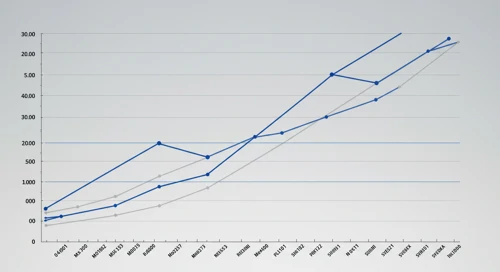
STZ: Fibonacci retracement levels to identify key potential support and resistance zones, based on recent price trends.
May 29, 2026 a 06:44 am
GLW: Fibunacci Level Technical Analysis - Corning Incorporated
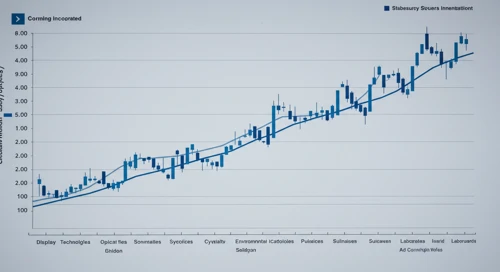
GLW: Fibonacci retracement levels to identify key potential support and resistance zones, based on recent price trends.
May 29, 2026 a 05:15 am
COP: Trend with Support and Resistance Levels - ConocoPhillips
COP: Current price trend is evaluated alongside key support and resistance level. View of potential turning points and price momentum.
May 29, 2026 a 04:03 am
ES: Trend with Support and Resistance Levels - Eversource Energy
May 29, 2026 a 09:03 am

HIG: Analysts Ratings - The Hartford Financial Services Group Inc
May 29, 2026 a 09:00 am

CBRE: Analysts Ratings - CBRE Group Inc
May 29, 2026 a 08:38 am

CBOE: Trend with Support and Resistance Levels - Cboe Global Markets Inc
May 29, 2026 a 08:15 am
APD: Trend with Support and Resistance Levels - Air Products and Chemicals Inc

APD: Current price trend is evaluated alongside key support and resistance level. View of potential turning points and price momentum.
May 29, 2026 a 03:15 am
D: Analysts Ratings - Dominion Energy Inc
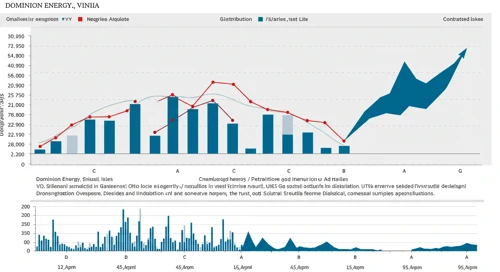
D: Comprehensive breakdown of current and historical analyst ratings, offering insights into how expert sentiment has evolved over time.
May 28, 2026 a 09:00 pm
ORCL: Analysts Ratings - Oracle Corporation

ORCL: Comprehensive breakdown of current and historical analyst ratings, offering insights into how expert sentiment has evolved over time.
May 28, 2026 a 08:38 pm
RF: Fundamental Ratio Analysis - Regions Financial Corporation
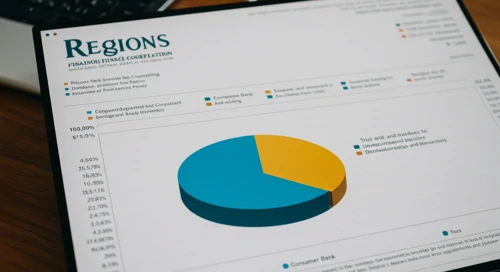
RF: Evaluation of key financial ratios, analyst ratings, and price targets. A data-driven perspective on the valuation and market expectations.
May 28, 2026 a 07:43 pm
KEYS: Fundamental Ratio Analysis - Keysight Technologies Inc
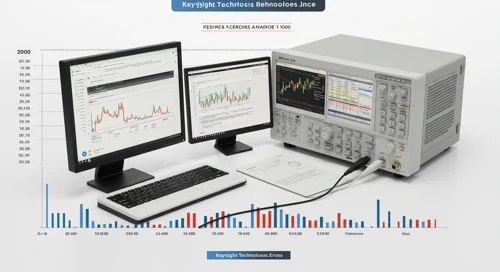
KEYS: Evaluation of key financial ratios, analyst ratings, and price targets. A data-driven perspective on the valuation and market expectations.
May 28, 2026 a 06:00 pm
CTSH: Analysts Ratings - Cognizant Technology Solutions Corporation

CTSH: Comprehensive breakdown of current and historical analyst ratings, offering insights into how expert sentiment has evolved over time.
May 28, 2026 a 05:00 pm
FRT: Fibunacci Level Technical Analysis - Federal Realty Investment Trust
FRT: Fibonacci retracement levels to identify key potential support and resistance zones, based on recent price trends.
May 28, 2026 a 04:44 pm
Economic Calendar
Currencies
Important Key Figures of the last Days
Overview of key economic indicators released over the past days, highlighting their potential impact on markets and investor sentiment.
May 28, 2026 a 02:31 am
Todays Important Key Figures 27 May

Today’s important economic data releases – a snapshot of key indicators influencing markets and shaping financial expectations.
May 27, 2026 a 07:00 pm
GBPAUD: Fibunacci Level Technical Analysis
GBPAUD: Fibonacci retracement levels to identify key potential support and resistance zones, based on recent price trends.
May 27, 2026 a 05:08 am
EURJPY: Trend with Support and Resistance Levels
EURJPY: Current price trend is evaluated alongside key support and resistance level. View of potential turning points and price momentum.
May 27, 2026 a 04:28 am
Todays Important Key Figures 26 May

Today’s important economic data releases – a snapshot of key indicators influencing markets and shaping financial expectations.
May 26, 2026 a 07:00 pm
CADJPY: Fibunacci Level Technical Analysis
CADJPY: Fibonacci retracement levels to identify key potential support and resistance zones, based on recent price trends.
May 26, 2026 a 05:08 am
EURGBP: Trend with Support and Resistance Levels
EURGBP: Current price trend is evaluated alongside key support and resistance level. View of potential turning points and price momentum.
May 26, 2026 a 04:28 am
GBPNZD: Fibunacci Level Technical Analysis
May 29, 2026 a 05:08 am
Todays Important Key Figures 28 May
May 28, 2026 a 07:00 pm
AUDUSD: Fibunacci Level Technical Analysis
May 28, 2026 a 05:08 am
USDCHF: Trend with Support and Resistance Levels
May 28, 2026 a 04:28 am
Important Key Figures of the last Days

Overview of key economic indicators released over the past days, highlighting their potential impact on markets and investor sentiment.
May 26, 2026 a 02:31 am
Todays Important Key Figures 25 May

Today’s important economic data releases – a snapshot of key indicators influencing markets and shaping financial expectations.
May 25, 2026 a 07:00 pm
GBPUSD: Fibunacci Level Technical Analysis
GBPUSD: Fibonacci retracement levels to identify key potential support and resistance zones, based on recent price trends.
May 25, 2026 a 05:08 am
GBPJPY: Trend with Support and Resistance Levels
GBPJPY: Current price trend is evaluated alongside key support and resistance level. View of potential turning points and price momentum.
May 25, 2026 a 04:28 am
GBPCAD: Fibunacci Level Technical Analysis
GBPCAD: Fibonacci retracement levels to identify key potential support and resistance zones, based on recent price trends.
May 24, 2026 a 05:08 am
NZDCAD: Trend with Support and Resistance Levels
NZDCAD: Current price trend is evaluated alongside key support and resistance level. View of potential turning points and price momentum.
May 24, 2026 a 04:28 am
AUDNZD: Fibunacci Level Technical Analysis
AUDNZD: Fibonacci retracement levels to identify key potential support and resistance zones, based on recent price trends.
May 23, 2026 a 05:08 am
Currencies