
May 29, 2026 a 12:31 pm

Indices - Performance Analysis
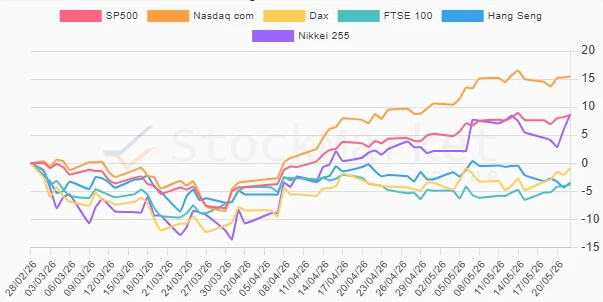
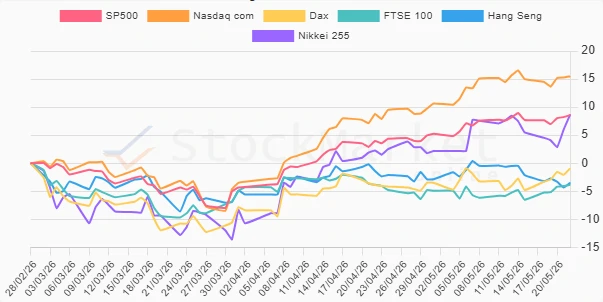
During the past week, global indices exhibited mixed performance, with European indices such as the DAX demonstrating strength, while others like the Nasdaq composite showed more moderate growth. Over the monthly horizon, significant gains were seen particularly in technology sectors. The three-month period highlights a robust rally in the Nasdaq alongside notable weaknesses in both the FTSE 100 and Hang Seng indices. This analysis delves into these trends, identifying key outliers and offering actionable insights.
Indices Performance One Week 📊
| Index | Performance (%) | Performance |
|---|---|---|
| Dax | 1.15 | |
| SP500 | 0.37 | |
| FTSE 100 | 0.22 | |
| Nasdaq com | 0.19 | |
| Hang Seng | 0.0 | |
| Nikkei 255 | 0.0 |
Indices Performance One Month 📈
| Index | Performance (%) | Performance |
|---|---|---|
| Nasdaq com | 6.66 | |
| Nikkei 255 | 5.81 | |
| SP500 | 4.61 | |
| Dax | 3.70 | |
| FTSE 100 | 1.38 | |
| Hang Seng | -1.89 |
Indices Performance Three Months 🗓️
| Index | Performance (%) | Performance |
|---|---|---|
| Nasdaq com | 15.47 | |
| Nikkei 255 | 8.67 | |
| SP500 | 8.59 | |
| Dax | -0.91 | |
| Hang Seng | -3.47 | |
| FTSE 100 | -3.85 |
Summary 🏁
The recent data reveals a dynamic landscape in global indices, with technology and growth sectors driving significant upward momentum, particularly in the US and Japan. Conversely, European markets showed mixed results with pressures observed principally in the UK. Investors should closely monitor these trends, considering potential macroeconomic influences while recalibrating portfolios towards sectors that continue to display resilience and growth. Emphasizing diversified exposure, particularly in thriving markets, could enhance risk-adjusted returns amidst these changing trends.
Smart Data Insight
Master the Perfect Entry & Exit for this Stock
Don't leave your profits to chance. Historically, this stock follows specific seasonal patterns that institutional traders use to maximize returns.
- ✅ Identify the "Golden Buying Window"
- ✅ Avoid high-risk correction cycles
- ✅ Backtested data from the last 20+ years