Review 2007 - 2009 - Financial crisis
From 03.2003 to 10.2007 the S&P 500 gained approx. 100 percent. The first signs of a crisis could already be seen in August 2007 when BNP Baribas stopped withdrawing cash. On September 14, 2007, the Bank of England rescued the British mortgage provider "Northern Rock", which had problems with many American customers due to insolvency. At the beginning of 2008, the US was in recession after two quarters of negative economic growth.
From 10.2007 to 06.03.2009, the prices of the major stock indices rose by more than 50 percent.
In the same period in which the global indices suffered heavy price losses, the ETF Portfolio Strategy gained more than 6.5 percent.
The performance of the ETF Portfolio Strategy differs significantly from the global indices.
The following picture shows that the ETF Portfolio Strategy was able to free itself from the downward pressure of the global stock indices. The result was a stable sideways movement. In view of the very difficult stock market environment, we are very satisfied with this development.
What are the reasons for the difference in performance?
Recession protection:
-
At the beginning of 2007, the US SMO Economic Stress indicator indicated a possible recession.
-
In the event of negative momentum in the stock indices and a signal from the US SMO Economic Stress Indicator, the asset classes are reallocated.
Diversification:
-
Even in a recession, we rely on several asset classes. This ensures diversification even in difficult stock market phases.
Money Management:
-
The ETF Portfolio Strategy regularly calculates the optimal weighting of the individual asset classes.
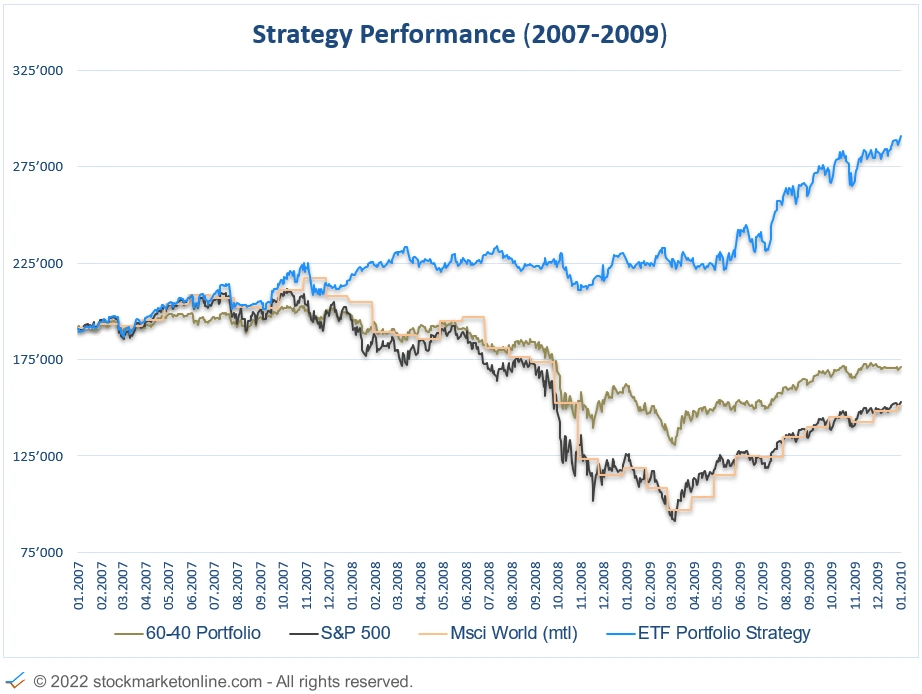
Performance & Drawdown Overview
The strategy is specialized in avoiding risks in the equity market. The investments are selected worldwide and focus on markets and assets that show positive growth.
The long-term outperformance of the global indices is a result of risk management.
Performance: Jan.2008 - Dec. 2009
Drawdowns: Jan.2007 - Dec. 2009
Drawdowns
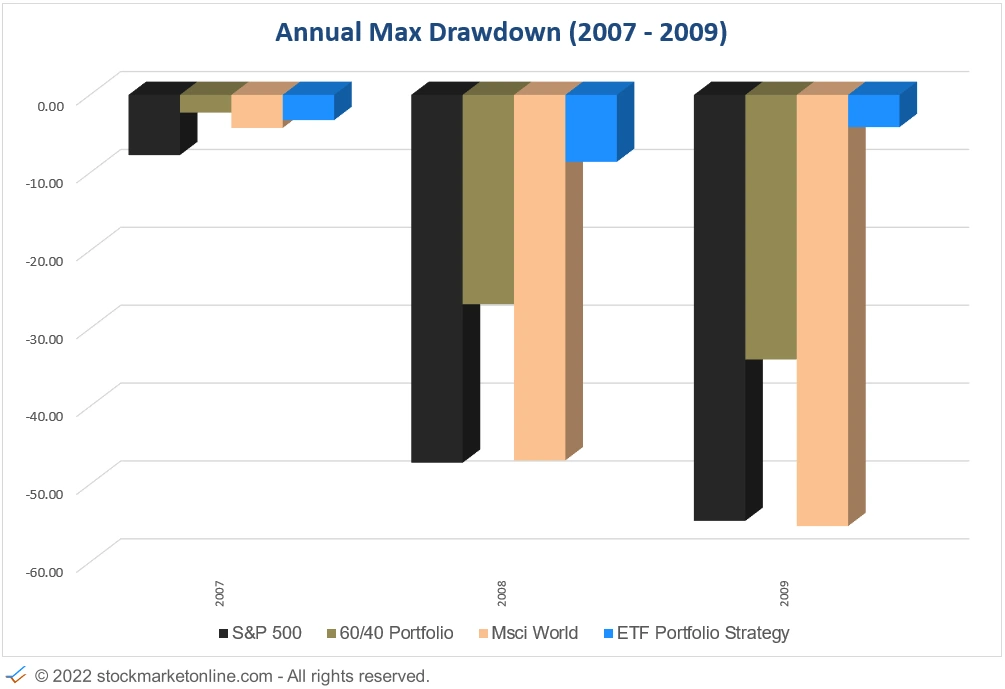
The following chart shows why avoiding large price declines is so crucial.
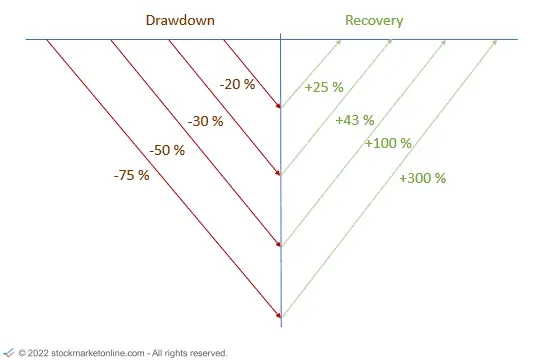
A price loss of 50 percent requires a subsequent price increase of 100 percent to make up for the loss.
Generating high price increases is always a challenge and depends significantly on the performance of the broad equity market.
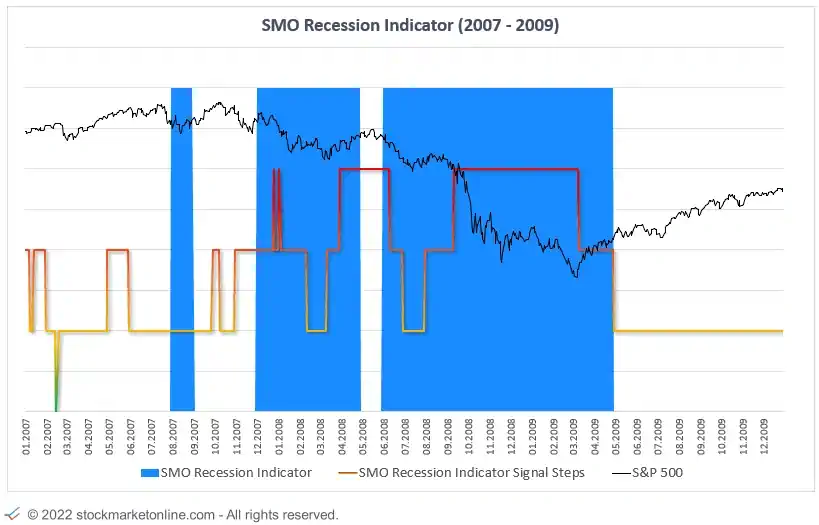
US SMO Economic Stress Indicator
The US SMO Economic Stress Indicator is an essential component of the ETF Portfolio Strategy.
Risk analysis
The US SMO Economic Stress Indicator has consistently provided signals in the period 2007 - 2009.
Signal August 2007:
-
In August 2007, the US SMO Economic Stress indicator signals a first warning sign of a recession.
Signal December 2007:
-
In December 2007, the US SMO Economic Stress indicator again signaled a possible recession. This time the indication was not temporary. The recession had been confirmed.
Signal January 2008:
-
In January 2008, three economic indicators signaled signs of economic problems.