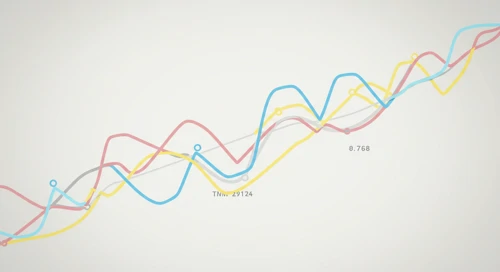
Crypto Comparison. 01 Aug

Comparison of Crypto. Where is strength and weakness? What has developed well and badly?
August 01, 2026 a 12:31 pm
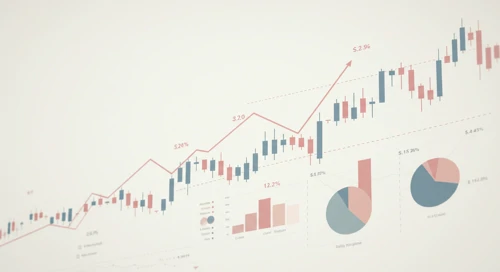
Industrial Comparison. 01 Aug

Comparison of Industrial. Where is strength and weakness? What has developed well and badly?
August 01, 2026 a 09:31 am
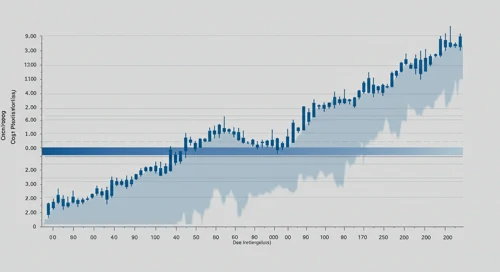
Europe Comparison. 31 Jul

Comparison of Europe. Where is strength and weakness? What has developed well and badly?
July 31, 2026 a 03:32 pm
Major Indices Comparison. 31 Jul
Comparison of Major Indices. Where is strength and weakness? What has developed well and badly?
July 31, 2026 a 12:31 pm
Technology Comparison. 31 Jul

Comparison of Technology. Where is strength and weakness? What has developed well and badly?
July 31, 2026 a 09:16 am
Financials Comparison. 30 Jul

Comparison of Financials. Where is strength and weakness? What has developed well and badly?
July 30, 2026 a 03:12 pm
Bonds Comparison. 30 Jul

Comparison of Bonds. Where is strength and weakness? What has developed well and badly?
July 30, 2026 a 12:32 pm

Retail Comparison. 02 Aug
August 02, 2026 a 03:11 pm

Regions Comparison. 02 Aug
August 02, 2026 a 12:31 pm
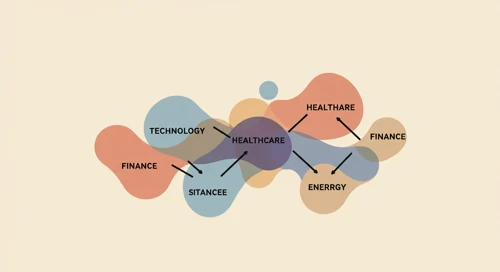
Healthcare Comparison. 02 Aug
August 02, 2026 a 09:31 am

Consumer Staples Comparison. 01 Aug
August 01, 2026 a 03:31 pm
Sectors Comparison. 30 Jul
Comparison of Sectors. Where is strength and weakness? What has developed well and badly?
July 30, 2026 a 09:32 am
Consumer Cyclical Comparison. 29 Jul

Comparison of Consumer Cyclical. Where is strength and weakness? What has developed well and badly?
July 29, 2026 a 03:31 pm
Asia Comparison. 29 Jul

Comparison of Asia. Where is strength and weakness? What has developed well and badly?
July 29, 2026 a 12:31 pm
Energy Comparison. 29 Jul

Comparison of Energy. Where is strength and weakness? What has developed well and badly?
July 29, 2026 a 09:32 am
Utilities Comparison. 28 Jul

Comparison of Utilities. Where is strength and weakness? What has developed well and badly?
July 28, 2026 a 03:16 pm
Commodities Comparison. 28 Jul

Comparison of Commodities. Where is strength and weakness? What has developed well and badly?
July 28, 2026 a 12:31 pm
Realestate Comparison. 28 Jul

Comparison of Realestate. Where is strength and weakness? What has developed well and badly?
July 28, 2026 a 09:32 am
Stock Market - Heatmap
Use mouse wheel to zoom in and out. Click a ticker to display detailed information in a new window. Hover mouse cursor over a ticker to see more data.
Stock's
UHS: Dividend Analysis - Universal Health Services Inc

UHS: In-depth analysis of a company's dividend stability and key fundamental ratios to assess its financial strength and long-term investment potential.
July 27, 2026 a 11:31 am
MU: Fibunacci Level Technical Analysis - Micron Technology Inc
MU: Fibonacci retracement levels to identify key potential support and resistance zones, based on recent price trends.
July 27, 2026 a 10:15 am
GOOGL: Analysts Ratings - Alphabet Inc
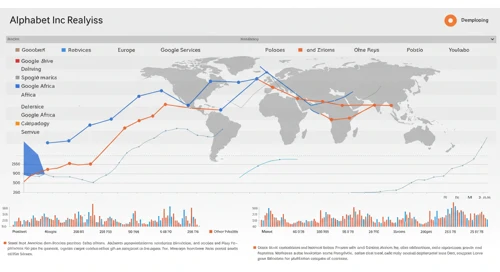
GOOGL: Comprehensive breakdown of current and historical analyst ratings, offering insights into how expert sentiment has evolved over time.
July 27, 2026 a 09:00 am
AZO: Analysts Ratings - AutoZone Inc

AZO: Comprehensive breakdown of current and historical analyst ratings, offering insights into how expert sentiment has evolved over time.
July 27, 2026 a 08:38 am
SWK: Trend with Support and Resistance Levels - Stanley Black and Decker Inc
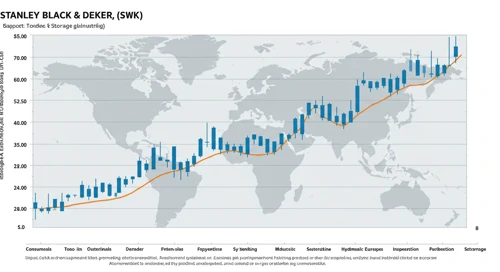
SWK: Current price trend is evaluated alongside key support and resistance level. View of potential turning points and price momentum.
July 27, 2026 a 08:15 am
PFG: Fundamental Ratio Analysis - Principal Financial Group Inc

PFG: Evaluation of key financial ratios, analyst ratings, and price targets. A data-driven perspective on the valuation and market expectations.
July 27, 2026 a 08:00 am
EL: Dividend Analysis - The Estée Lauder Companies Inc

EL: In-depth analysis of a company's dividend stability and key fundamental ratios to assess its financial strength and long-term investment potential.
July 27, 2026 a 07:46 am

EXPD: Dividend Analysis - Expeditors International of Washington Inc
July 27, 2026 a 12:46 pm
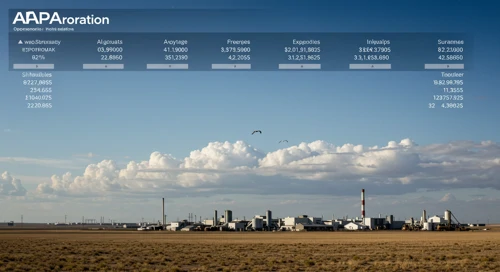
APA: Analysts Ratings - APA Corporation
July 27, 2026 a 12:38 pm
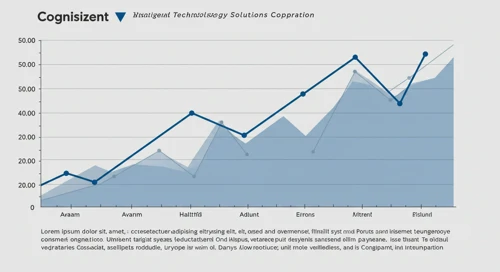
CTSH: Fibunacci Level Technical Analysis - Cognizant Technology Solutions Corporation
July 27, 2026 a 11:44 am
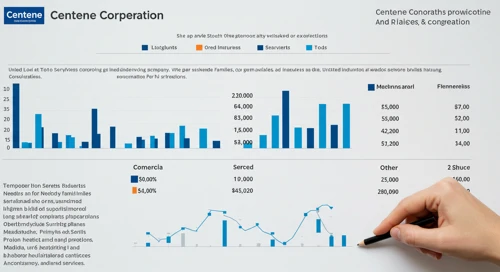
CNC: Fundamental Ratio Analysis - Centene Corp
July 27, 2026 a 11:43 am
AMCR: Fundamental Ratio Analysis - Amcor plc
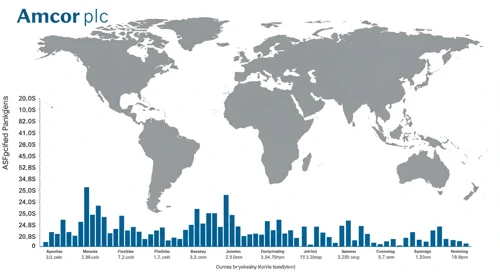
AMCR: Evaluation of key financial ratios, analyst ratings, and price targets. A data-driven perspective on the valuation and market expectations.
July 27, 2026 a 07:43 am
SYY: Fibunacci Level Technical Analysis - Sysco Corporation
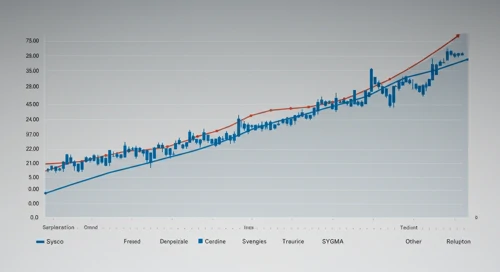
SYY: Fibonacci retracement levels to identify key potential support and resistance zones, based on recent price trends.
July 27, 2026 a 06:44 am
HSIC: Fibunacci Level Technical Analysis - Henry Schein Inc
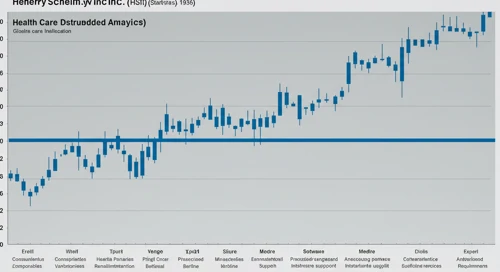
HSIC: Fibonacci retracement levels to identify key potential support and resistance zones, based on recent price trends.
July 27, 2026 a 05:15 am
PNR: Dividend Analysis - Pentair plc
PNR: In-depth analysis of a company's dividend stability and key fundamental ratios to assess its financial strength and long-term investment potential.
July 27, 2026 a 03:31 am
IBM: Trend with Support and Resistance Levels - International Business Machines Corporation

IBM: Current price trend is evaluated alongside key support and resistance level. View of potential turning points and price momentum.
July 27, 2026 a 03:15 am
NTAP: Dividend Analysis - NetApp Inc
NTAP: In-depth analysis of a company's dividend stability and key fundamental ratios to assess its financial strength and long-term investment potential.
July 27, 2026 a 02:46 am
RF: Analysts Ratings - Regions Financial Corporation
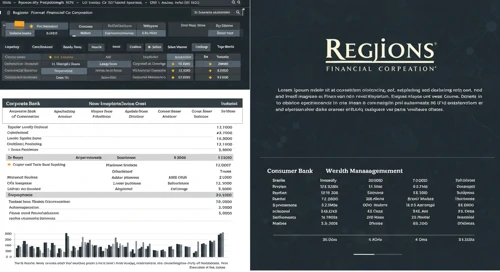
RF: Comprehensive breakdown of current and historical analyst ratings, offering insights into how expert sentiment has evolved over time.
July 26, 2026 a 09:00 pm
Economic Calendar
Currencies
NZDCHF: Trend with Support and Resistance Levels
NZDCHF: Current price trend is evaluated alongside key support and resistance level. View of potential turning points and price momentum.
July 26, 2026 a 04:28 am
GBPCAD: Fibunacci Level Technical Analysis
GBPCAD: Fibonacci retracement levels to identify key potential support and resistance zones, based on recent price trends.
July 25, 2026 a 05:08 am
CADJPY: Trend with Support and Resistance Levels
CADJPY: Current price trend is evaluated alongside key support and resistance level. View of potential turning points and price momentum.
July 25, 2026 a 04:28 am
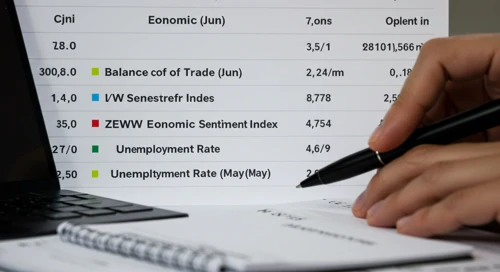
Todays Important Key Figures 25 Jul
Today’s important economic data releases – a snapshot of key indicators influencing markets and shaping financial expectations.
July 24, 2026 a 11:00 pm
Todays Important Key Figures 24 Jul

Today’s important economic data releases – a snapshot of key indicators influencing markets and shaping financial expectations.
July 24, 2026 a 07:00 pm
EURGBP: Fibunacci Level Technical Analysis
EURGBP: Fibonacci retracement levels to identify key potential support and resistance zones, based on recent price trends.
July 24, 2026 a 05:08 am
Todays Important Key Figures 23 Jul

Today’s important economic data releases – a snapshot of key indicators influencing markets and shaping financial expectations.
July 23, 2026 a 07:00 pm

Todays Important Key Figures 27 Jul
July 27, 2026 a 11:00 am
GBPNZD: Fibunacci Level Technical Analysis
July 27, 2026 a 05:08 am
NZDJPY: Trend with Support and Resistance Levels
July 27, 2026 a 04:28 am
NZDUSD: Fibunacci Level Technical Analysis
July 26, 2026 a 05:08 am
AUDNZD: Fibunacci Level Technical Analysis
AUDNZD: Fibonacci retracement levels to identify key potential support and resistance zones, based on recent price trends.
July 23, 2026 a 05:08 am
CADCHF: Trend with Support and Resistance Levels
CADCHF: Current price trend is evaluated alongside key support and resistance level. View of potential turning points and price momentum.
July 23, 2026 a 04:28 am
Important Key Figures of the last Days
Overview of key economic indicators released over the past days, highlighting their potential impact on markets and investor sentiment.
July 23, 2026 a 02:31 am
Todays Important Key Figures 22 Jul

Today’s important economic data releases – a snapshot of key indicators influencing markets and shaping financial expectations.
July 22, 2026 a 07:00 pm
GBPSEK: Fibunacci Level Technical Analysis
GBPSEK: Fibonacci retracement levels to identify key potential support and resistance zones, based on recent price trends.
July 22, 2026 a 05:08 am
EURJPY: Trend with Support and Resistance Levels
EURJPY: Current price trend is evaluated alongside key support and resistance level. View of potential turning points and price momentum.
July 22, 2026 a 04:28 am
Todays Important Key Figures 21 Jul
Today’s important economic data releases – a snapshot of key indicators influencing markets and shaping financial expectations.
July 21, 2026 a 07:00 pm
Currencies