Dow Jones Index - Seasonality Backtest (20years)

by SMO Team
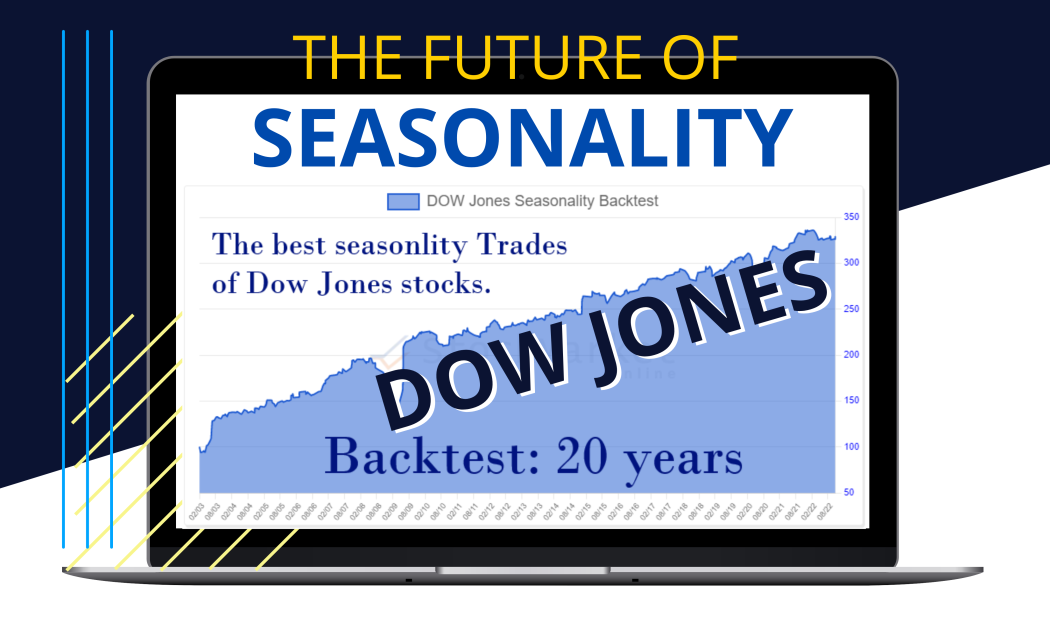
We demonstrate how simple it is to apply seasonal patterns to stocks and what spectacular results can be obtained with it using a backtest of the Dow Jones equities over the previous 20 years.
Backtest
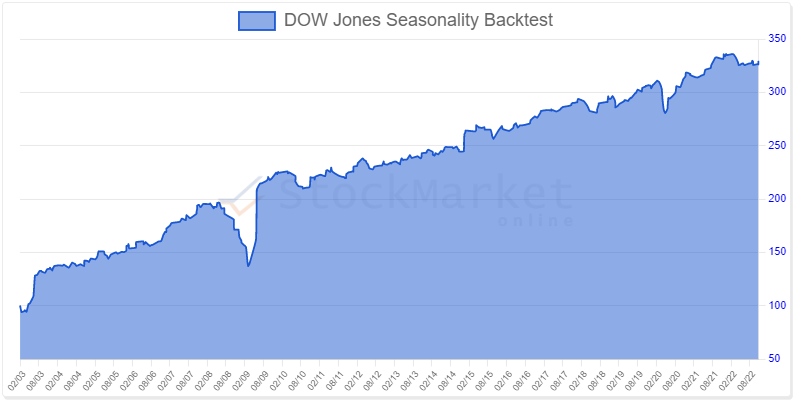
The backtest shows how well a strategy based purely on seasonal trend and price momentum works.
To identify the right stocks, we used the search algorithm of our Seasonality Screener. Based on historical price data, this algorithm determines the period in which recurring rising stock prices occur. The quality of the price rises is evaluated by means of key figures.
In our backtest we used the three best results of the Seasonality Screener for our strategy. The three stocks were selected based on the best Sortino Ratio and the best Winning trades (Hit Ratio). These numbers can also be found in our Seasonality Screener and in the Seasonality Chart Analyzer.
The trades have different durations, which are from 5 to 100 days.
The components of the Dow Jones Index have changed several times over the last 20 years. We have chosen the stocks used based on the entries and exits of various companies from wikipedia list.
Backtest rules
- Stocks in the Dow Jones Industrial Index. Source which stocks are and were in the index when is wikipedia.
- Maximum three positions at the same time
- Each position is 1/3 of the portfolio value
- The three best seasonal patterns are chosen
- Best hit ratio
- Best Sortino Ratio
- Individual trade duration is between 5 -100 days
- Stop Loss Orders: No
- Take Profit Orders: No
Development During The Financial Crises
As can be clearly seen from the backtest portfolio development, the strategy also generated losses during the financial crisis. The maximum drawdown is -29 percent. However, this is a much smaller loss than the Dow Jones itself suffered, which was -54 percent.
Development during the Corona Crash
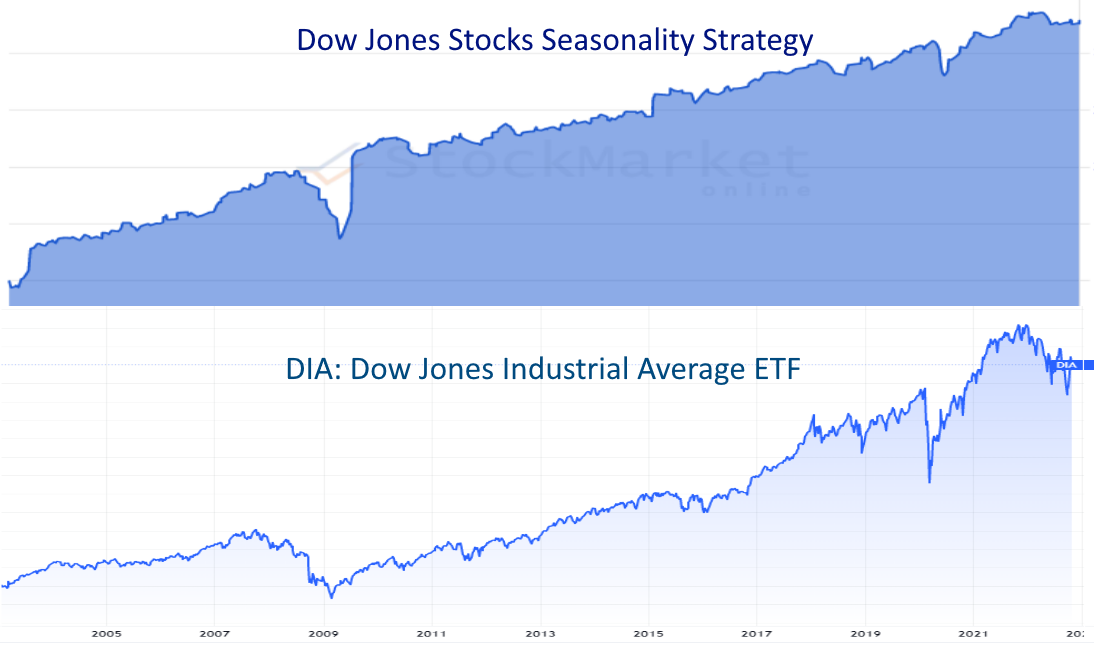
The performance of the seasonal strategy during the Corona Crash is much better than the performance of the whole Dow Jones Index. The drawdown is only -15 percent. In contrast, the drawdown of the Dow Jones Index was -39 percent.
The recovery until the drawdown was overcome takes the same time for the seasonal strategy and the Dow Jones Index.
Summary
The result shows what good trading results can be achieved with the use of seasonality.
The gains are slightly higher than in the Dow Jones Index. And the fluctuation range is much lower than in the Dow Jones Index.
The development of the strategy in the last crises has shown that a statistical approach using seasonal patterns is a very good way to generate stable profits.
If you also want to profit from seasonality, you can use our Seasonality Analyzer and our Seasonality Screener.