PLD: Analysts Ratings - Prologis Inc

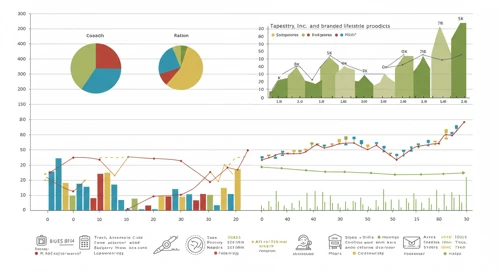
TPR: Fundamental Ratio Analysis - Tapestry Inc
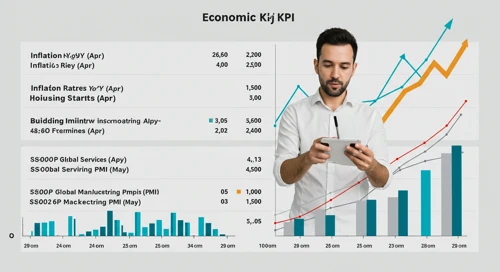
Todays Important Key Figures 22 May

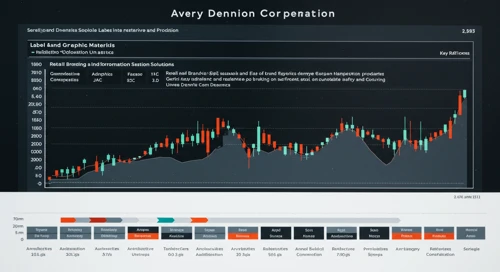
AVY: Fundamental Ratio Analysis - Avery Dennison Corporation
DLTR: Analysts Ratings - Dollar Tree Inc

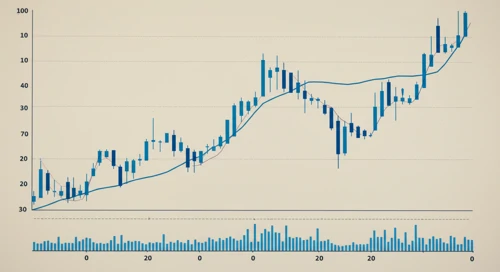
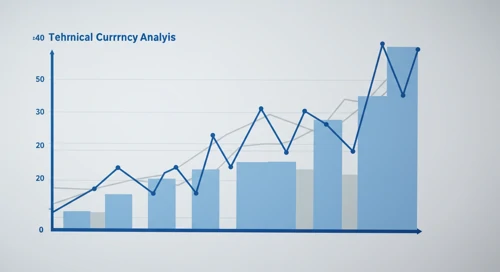
MMC: Fibunacci Level Technical Analysis - Marsh and McLennan Companies Inc
MLM: Analysts Ratings - Martin Marietta Materials Inc
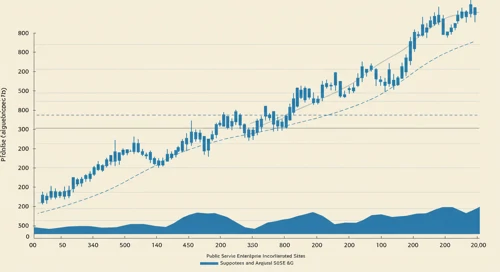
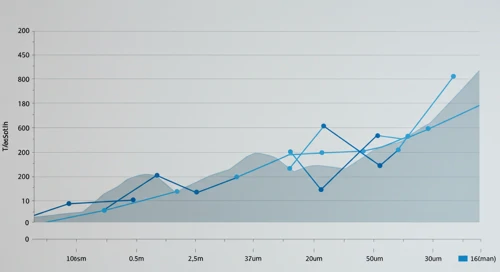
PEG: Trend with Support and Resistance Levels - Public Service Enterprise Group Incorporated
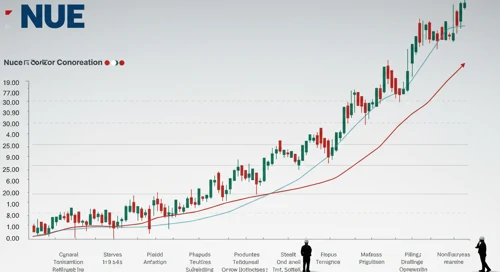
NUE: Dividend Analysis - Nucor Corporation
Todays Important Key Figures 23 May
BDX: Analysts Ratings - Becton Dickinson and Company
EXR: Fundamental Ratio Analysis - Extra Space Storage Inc

PRU: Dividend Analysis - Prudential Financial Inc

Europe Comparison. 22 May

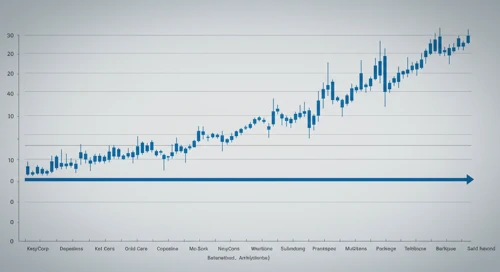
KEY: Fibunacci Level Technical Analysis - KeyCorp
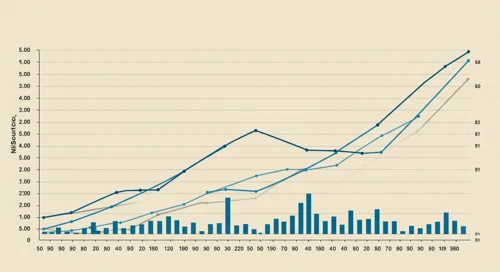
NI: Trend with Support and Resistance Levels - NiSource Inc
V: Fundamental Ratio Analysis - Visa Inc
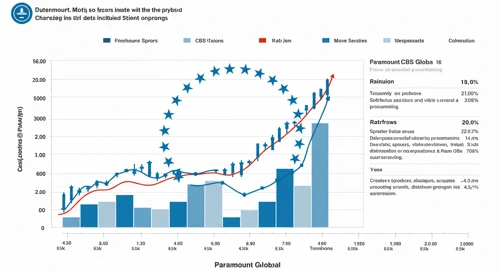
PARA: Analysts Ratings - Paramount Global
Stock's
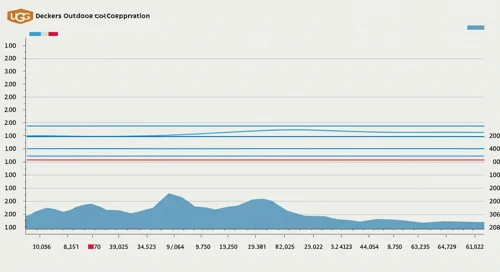
DECK: Fibunacci Level Technical Analysis - Deckers Outdoor Corporation
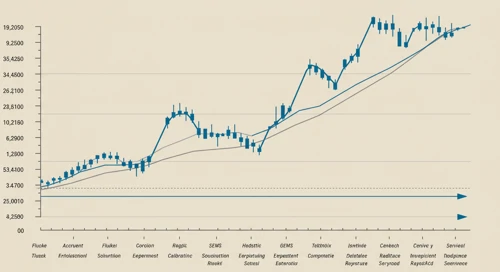
FTV: Trend with Support and Resistance Levels - Fortive Corporation
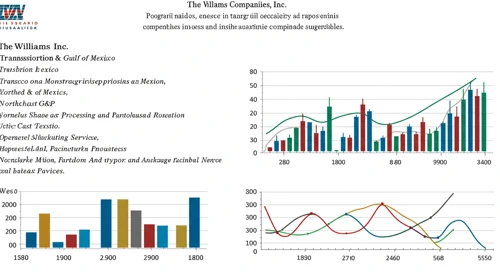
WMB: Analysts Ratings - The Williams Companies Inc
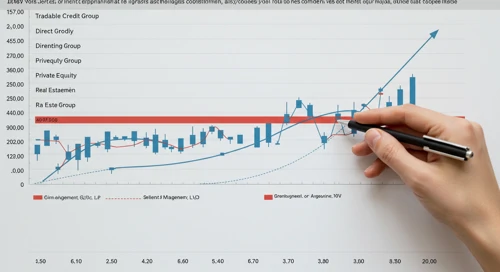
ARES: Analysts Ratings - Ares Management Corporation
WBD: Trend with Support and Resistance Levels - Warner Bros Discovery Inc
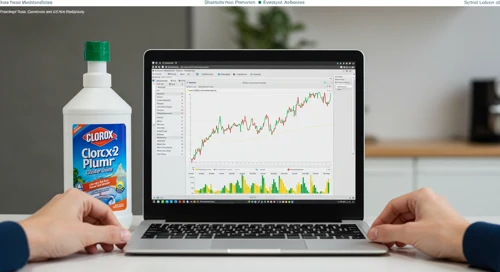
CLX: Fundamental Ratio Analysis - The Clorox Company
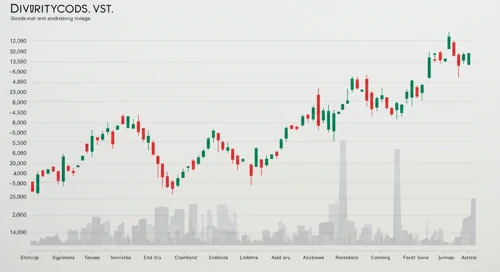
VST: Dividend Analysis - Vistra Corp

ADI: Dividend Analysis - Analog Devices Inc
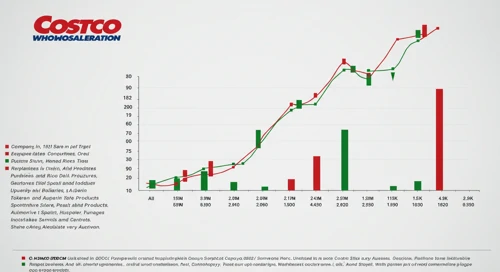
COST: Analysts Ratings - Costco Wholesale Corporation
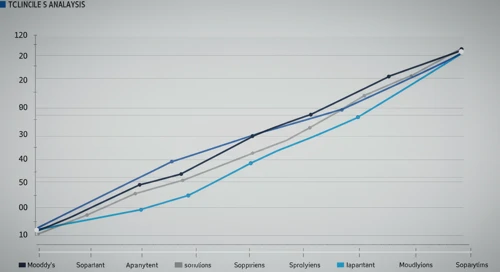
MCO: Fibunacci Level Technical Analysis - Moodys Corporation

DLTR: Fundamental Ratio Analysis - Dollar Tree Inc
TKO: Fundamental Ratio Analysis - TKO Group Holdings Inc

WFC: Dividend Analysis - Wells Fargo and Company

GOOGL: Fibunacci Level Technical Analysis - Alphabet Inc
LITE: Fibunacci Level Technical Analysis - Lumentum Holdings Inc

MMC: Trend with Support and Resistance Levels - Marsh and McLennan Companies Inc
USB: Trend with Support and Resistance Levels - US Bancorp

MPWR: Analysts Ratings - Monolithic Power Systems Inc
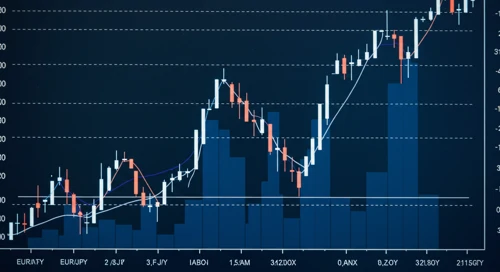
Currencies
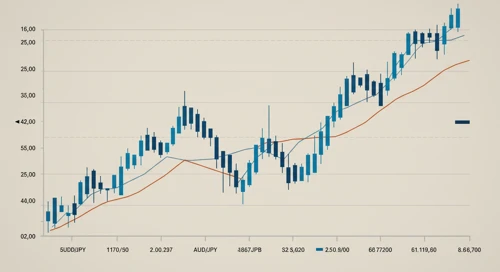
AUDJPY: Trend with Support and Resistance Levels
Important Key Figures of the last Days

Todays Important Key Figures 20 May

CADCHF: Fibunacci Level Technical Analysis
Todays Important Key Figures 19 May

CADJPY: Fibunacci Level Technical Analysis
EURJPY: Trend with Support and Resistance Levels
USDJPY: Fibunacci Level Technical Analysis
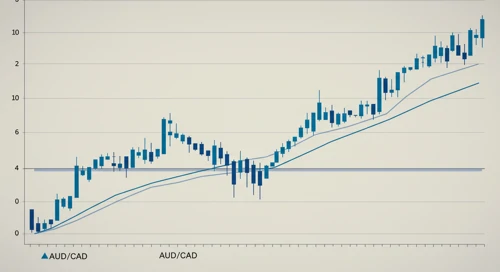
AUDCAD: Trend with Support and Resistance Levels
Todays Important Key Figures 21 May
EURAUD: Fibunacci Level Technical Analysis
Important Key Figures of the last Days
Todays Important Key Figures 18 May

NZDCHF: Fibunacci Level Technical Analysis
EURCHF: Trend with Support and Resistance Levels
GBPUSD: Fibunacci Level Technical Analysis
AUDUSD: Fibunacci Level Technical Analysis
EURGBP: Trend with Support and Resistance Levels