May 22, 2026 a 03:15 pm
KEY: Fibonacci Analysis - KeyCorp
KeyCorp has shown significant fluctuations in its stock prices over the last months, with a noticeable upward trend recently. This upward movement can be attributed to its strategic initiatives and robust product offerings in retail and commercial banking services. Investors may find this bullish trend reassuring, however, they should remain cautious of potential market volatilities.
Fibonacci Analysis
| Detail | Information |
|---|---|
| Trend Start Date | 2025-11-17 |
| Trend End Date | 2026-05-22 |
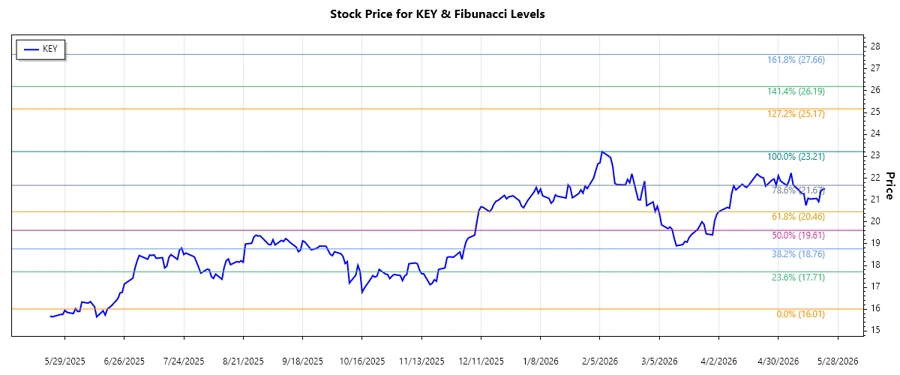
| High Point | 23.21 (2026-02-06) |
| Low Point | 16.01 (2025-06-18) |
| Fibonacci Level 0.236 | 17.92 |
| Fibonacci Level 0.382 | 18.74 |
| Fibonacci Level 0.5 | 19.61 |
| Fibonacci Level 0.618 | 20.49 |
| Fibonacci Level 0.786 | 21.53 |
| Current Price | 21.51 |
| Current Retracement Zone | 0.786 |
| Interpretation | The current price nearing the 0.786 retracement level indicates potential resistance. If breached, it could confirm a continuation of the upward trend. |
Conclusion
The analysis of KeyCorp's stock indicates a strong upward trend with prices approaching crucial resistance levels identified by the Fibonacci retracement. This suggests the possibility of either a continued upward momentum or a temporary pullback. Investors should weigh the favorable stock performance against potential risks associated with economic fluctuations and market conditions. Continuous monitoring of support and resistance levels is essential for making informed investment decisions.
Smart Data Insight
Master the Perfect Entry & Exit for this Stock
Don't leave your profits to chance. Historically, this stock follows specific seasonal patterns that institutional traders use to maximize returns.
- ✅ Identify the "Golden Buying Window"
- ✅ Avoid high-risk correction cycles
- ✅ Backtested data from the last 20+ years