Review 2018 - 2020 – Corona Crises
Everyone is familiar with the Corona Crisis. In January 2020, the World Health Organization declared the COVID-19 virus a global pandemic. When the first infected people appeared in Europe and the USA, there was an unprecedented stock market crash. Never before had the stock market fallen so much in such a short time.
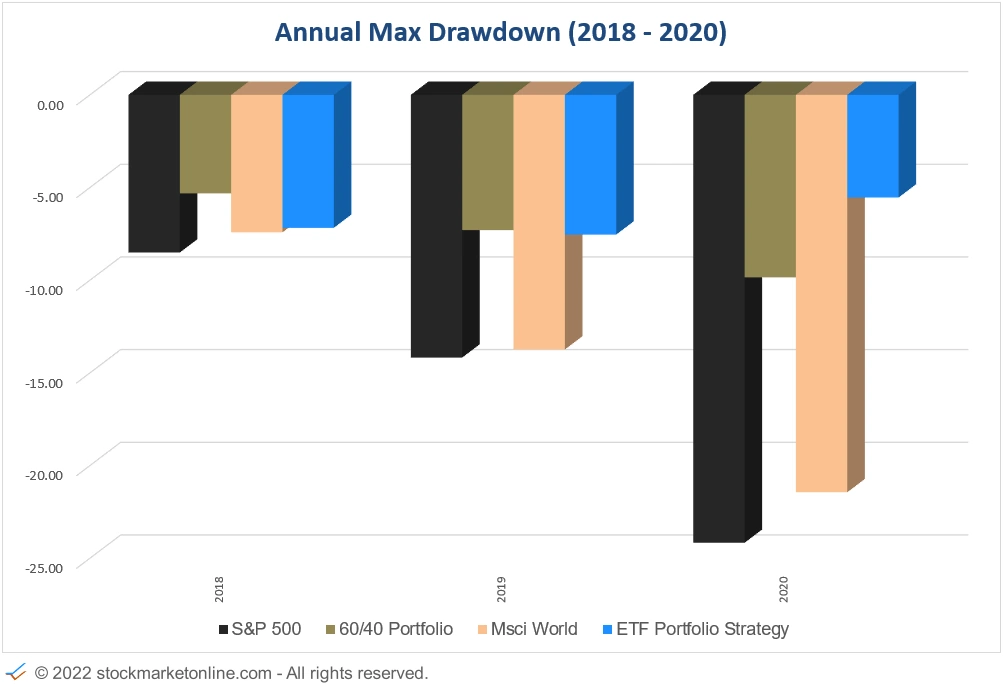
The S&P 500 fell by 35 percent and the MSCI World also lost about 35 percent.
The ETF Portfolio Strategy lost about 8 per cent in the Corona Crash. Overall, the ETF Portfolio Strategy gained more than 29 per cent in 2020.
In this review, we would also like to take a brief look at 2018. There were also difficult phases on the stock markets this year.
The performance of the ETF Portfolio Strategy differs significantly from the global indices.
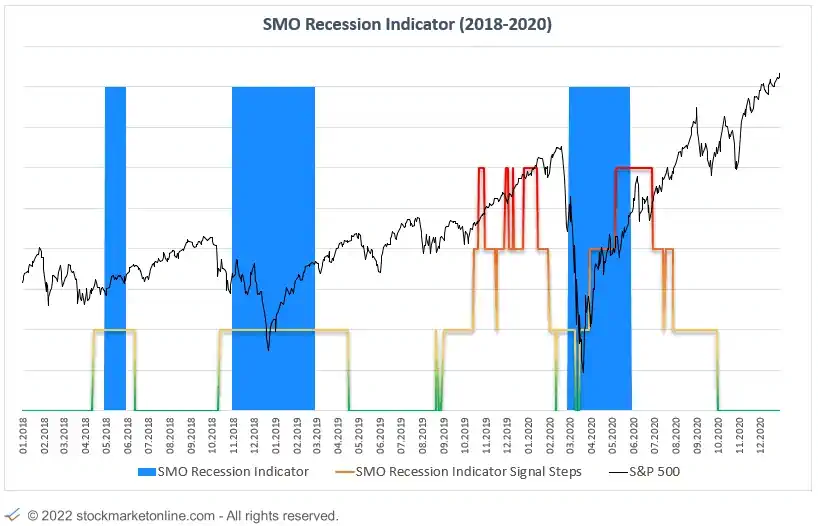
As you can see in the following picture, the SMO investment strategy was able to shine in 2020 with a very low drawdown. Some luck is also involved, because if you look at the US SMO Economic Stress Indicator, you will see that the economic indicators signaled trouble in early 2020. If the Corona crisis had occurred at a different time with absolute economic strength, our drawdown might have been a little worse.
The year 2018 was also marked by some turbulence. This year, the global stock market plummeted by around 20 percent. However, the ETF Portfolio Strategy was also convincing this year with a drawdown of less than 10 per cent.
What are the reasons for the difference in performance?
Recession protection:
-
At the beginning of 2018, the US SMO Economic Stress Indicator indicated a possible recession.
-
In the event of negative momentum in the stock indices and a signal from the US SMO Economic Stress Indicator, the asset classes are reallocated.
Diversification:
-
Even in a recession, we rely on several asset classes. This ensures diversification even in difficult stock market phases.
Money Management:
-
The ETF Portfolio Strategy regularly calculates the optimal weighting of the individual asset classes.
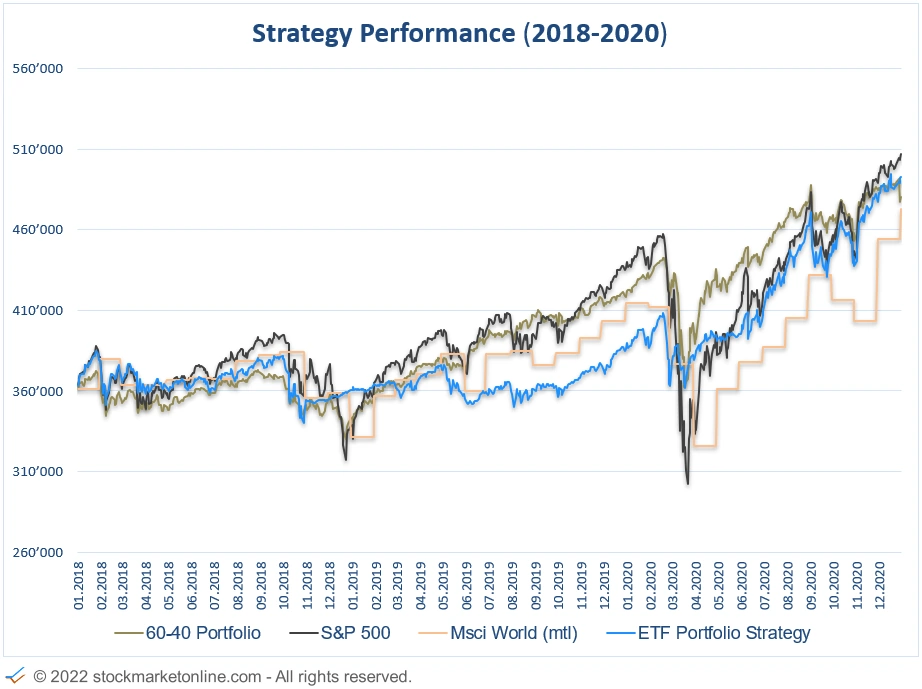
Performance & Drawdown Overview
The strategy is specialized in avoiding risks in the equity market. The investments are selected worldwide and focus on markets and assets that show positive growth.
The long-term outperformance of the global indices is a result of risk management.
Performance: Jan.2020 - Dec. 2021
Drawdowns: Jan.2020 - Dec. 2021
Drawdowns
The following chart shows why avoiding large price declines is so crucial.
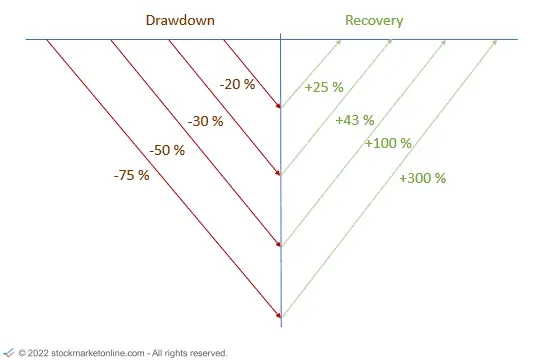
A price loss of 50 percent requires a subsequent price increase of 100 percent to make up for the loss.
Generating high price increases is always a challenge and depends significantly on the performance of the broad equity market.
US SMO Economic Stress Indicator
The US SMO Economic Stress Indicator is an essential component of the ETF Portfolio Strategy.
As described earlier in the article, sometimes it also takes a bit of luck. If you look at the US SMO Economic Stress Indicator, you will see that the economic indicators have signaled problems in the early 2020s.
Risk analyzes
The US SMO Economic Stress Indicator has provided durable signals in the 2018 - 2020 period.
Signal May 2018:
-
In May 2018, the US SMO Economic Stress Indicator signals a first warning sign of a recession.
Signal November 2018:
-
In November 2018, the US SMO Economic Stress indicator again signaled a possible recession. This signal proved to be very helpful. The stock market subsequently fell by around 10 per cent.
Signal March 2020:
-
In March 2008, only one economic indicator signaled problems. This signaling helped us to survive the Corona Crise unscathed.