How it works.
The ETF Portfolio Strategy is a multidimensional factor algorithm that systematically analyses and evaluates data-driven information.
Every month, the positions are adjusted based on a risk assessment and market analysis.
The focus is on risk management and performance optimization.
Historical Performance
Long-term outperformance of various indices through risk minimization.
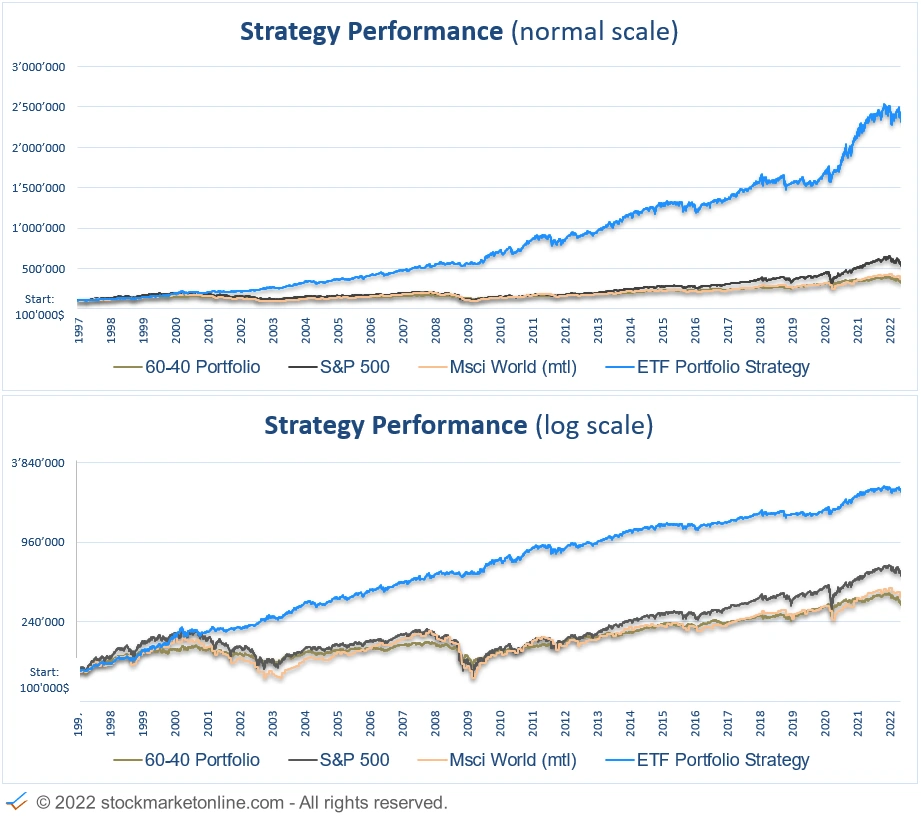
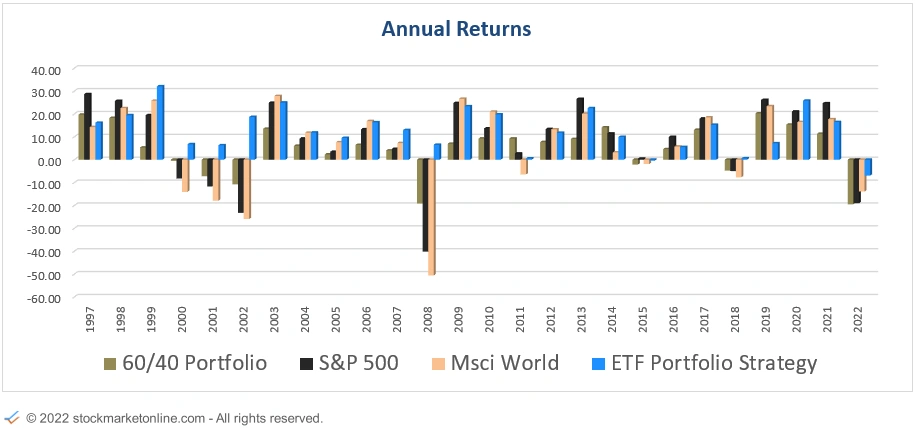
Overall Performance
Performance
Data history from 1997 - today.
The ETF Portfolio Strategy specializes in avoiding risks in the stock market. The investments are spread around the world and focus on markets and assets that show positive growth.
The long-term outperformance of global indices is a result of risk management.
Historical Drawdowns
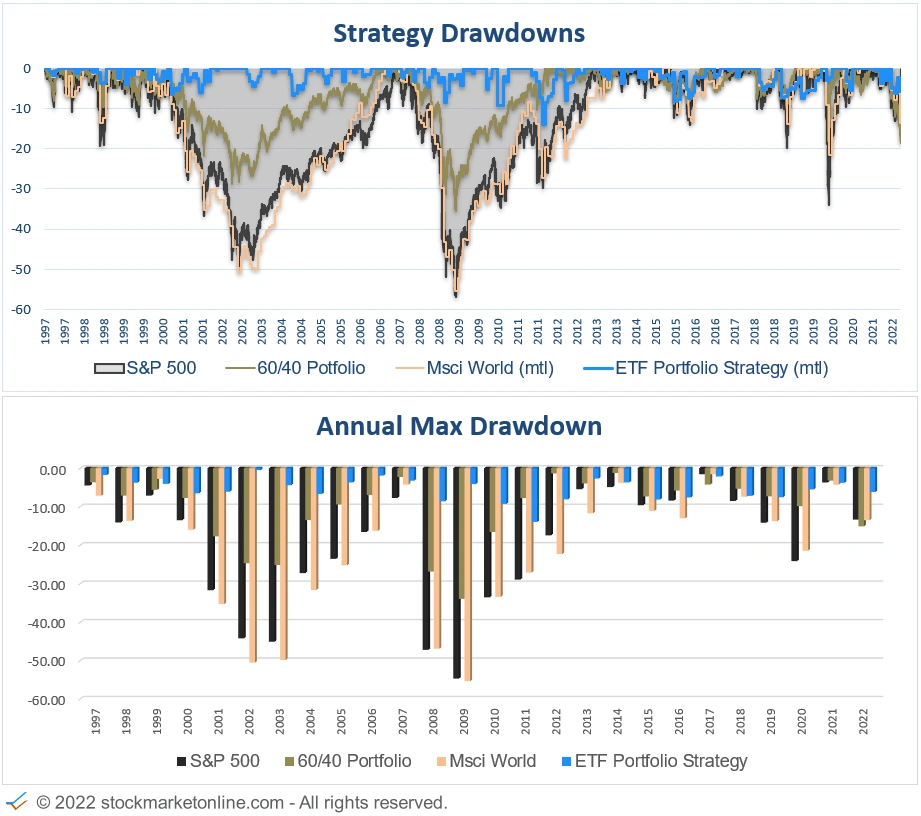
Low drawdowns due to multi-level risk management
How big were the Drawdowns?
Drawdowns
Data history from 1997 - today.
Low drawdown of the ETF Portfolio Strategy through multi-level risk management.
-
Recession indicator protects against major price declines.
-
Broad diversification
-
Money management
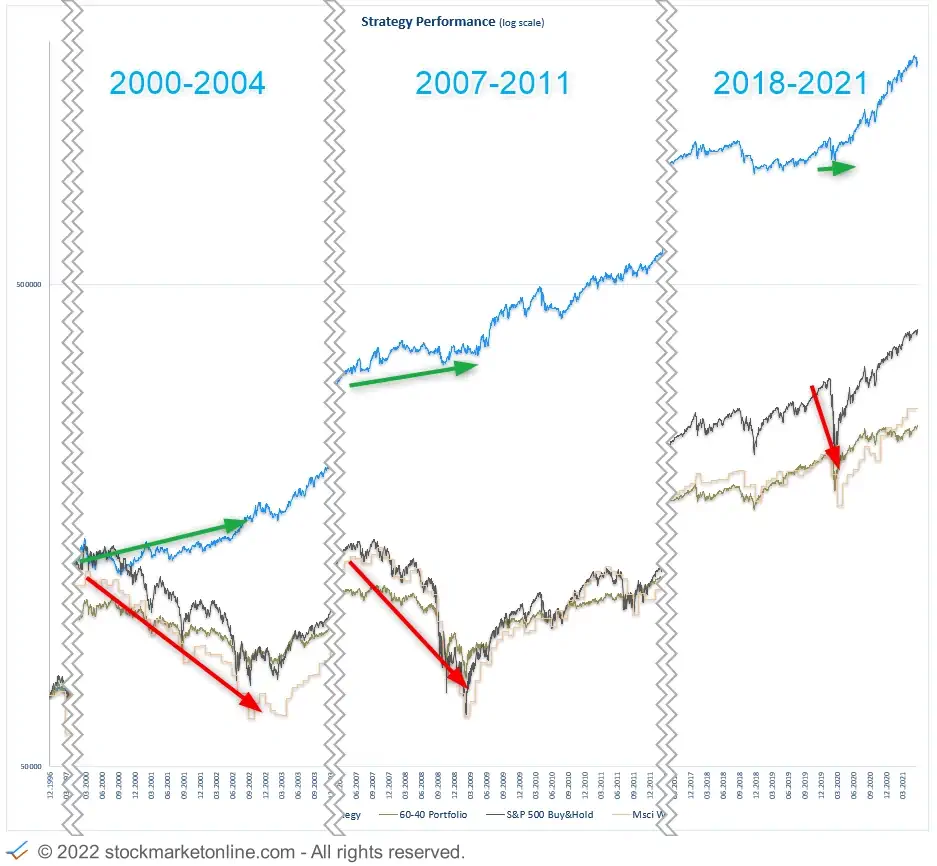
Performance in Big Recessions
How has the ETF Portfolio Strategy performed during the last major recessions?
Historical Result in Recessions
Performance in Recessions
Max Drawdowns in Recessions
Data history from 1997 - today.
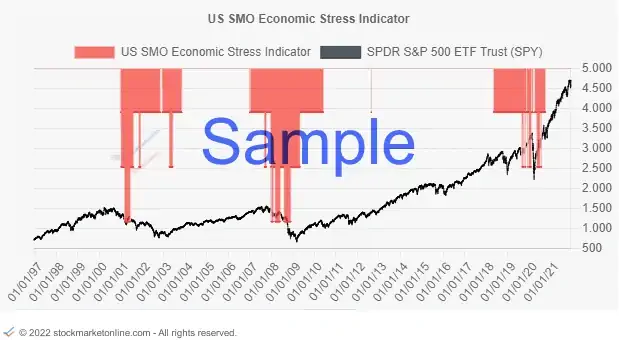
The performance of the ETF Portfolio Strategy in recessions is made possible through the use of the US SMO Economic Stress Indicator.
The ETF Portfolio Strategy had the largest drawdown outside of a recession in 2011. The drawdown was -13.99%.
The architecture of the strategy is based on a multifactor approach that combines various components.
Multi-dimensional risk management
Recession protection:
-
The SMO Recession Indicator analyses leading economic indicators and forecasts upcoming recessions.
-
"Large" price declines in volatile times are avoided.
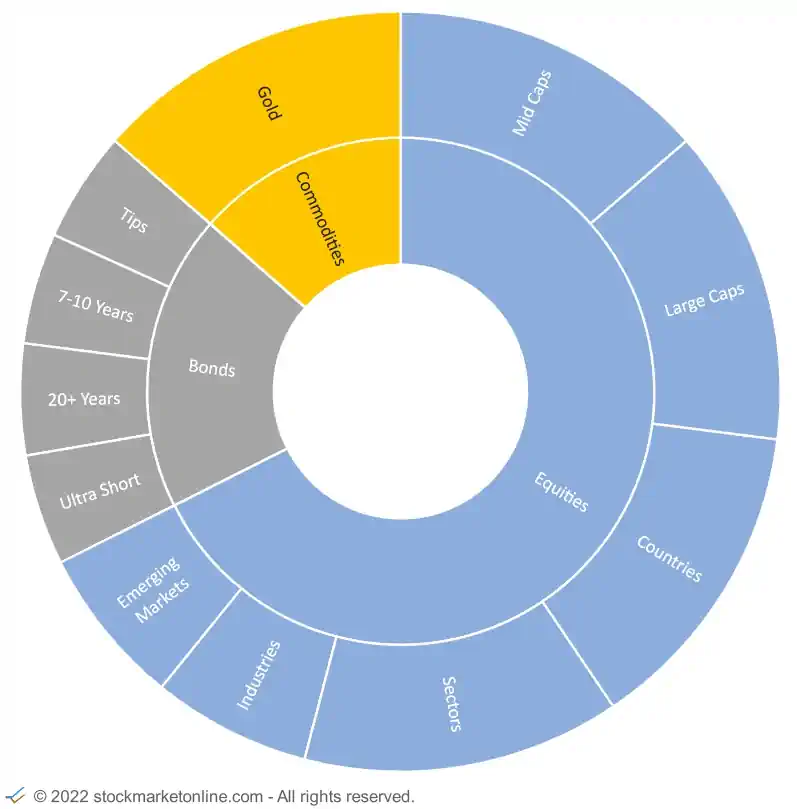
Diversification:
-
Different ETFs, minimize the risk of the individual. The strategy selects from over 70 ETFs.
-
Using of different market valuation models and strategies is essential for diversification and risk minimization.
-
Different sub-strategies optimize diversification in terms of geography, sectors, economic phases and timing
Money Management:
-
Weighting and rebalancing.
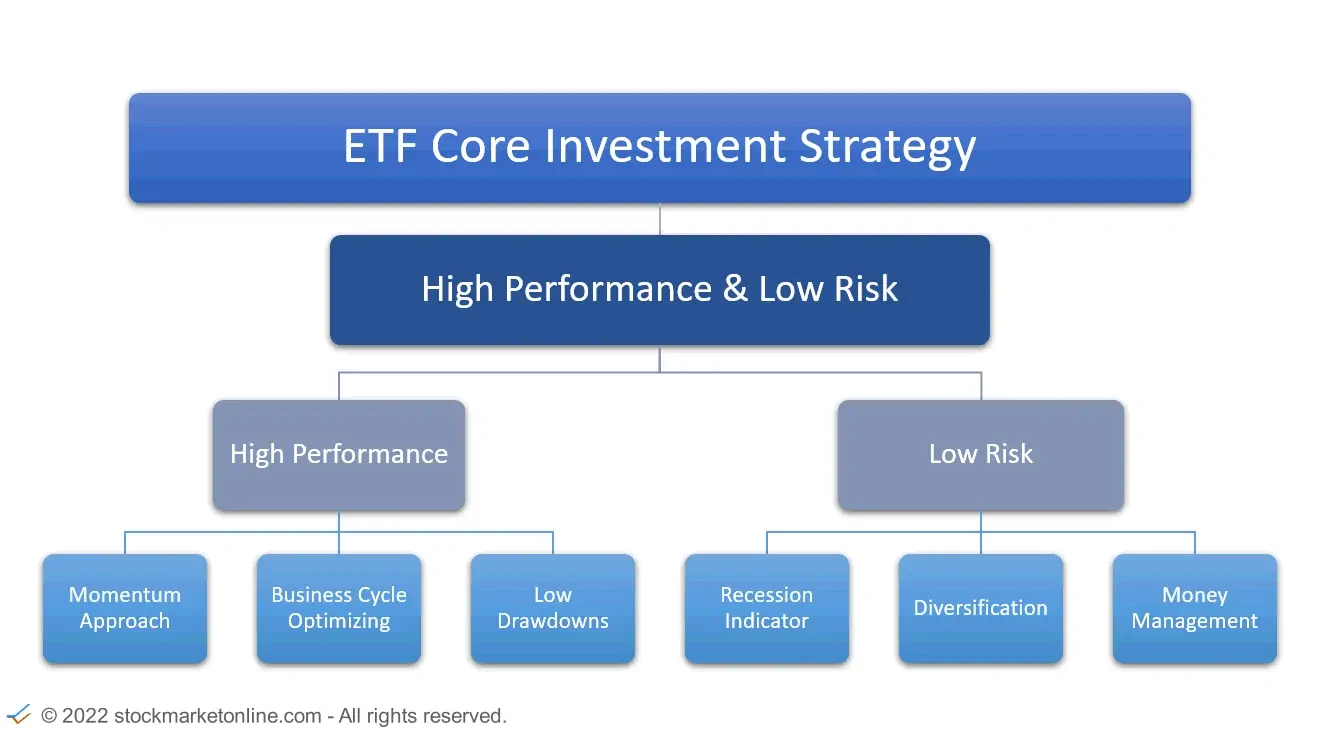
Business Cycle and Momentum
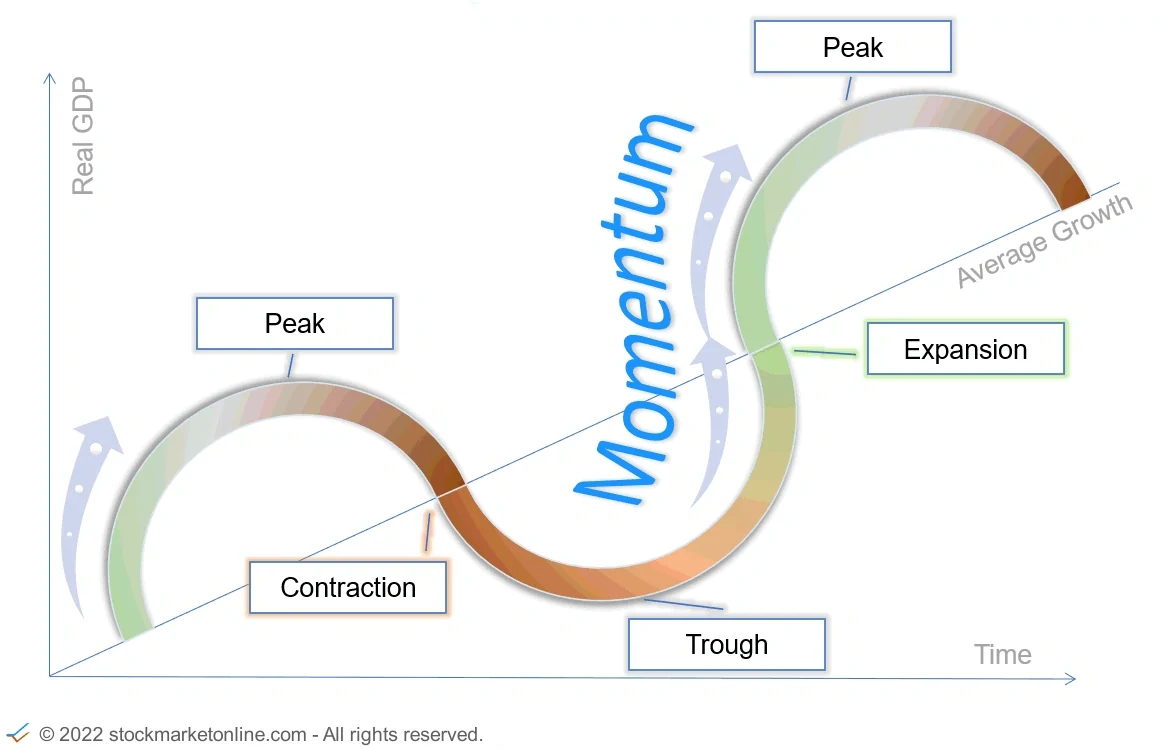
The architecture is based on a multifactor approach that combines various components.
Multifactor performance optimization
Strategy selection:
-
Economic cycle Optimized strategy selection.
Momentum Strategies:
-
Relative strength according to Robert a. Levy. The trend is your friend.
Minimum downside volatility / minimum drawdown:
-
Low drawdown strategy
Strategy Content
The content of the Portfolio Strategy is divided into two areas and can be described as a Dual Portfolio Strategy.
Dual Portfolio Strategy
Normal condition strategy
Normal condition strategy
-
The results of over 10 different strategies are combined into one strategy. The strategies are weighted differently depending on the economic cycle.
-
The strategies select the appropriate ETFs from over 70.
Recession Strategy
Recession Strategy
-
When the recession indicator shows a possible risk, we switch to asset classes that have historically performed well in a recession.
US SMO Economic Stress Indicator
The US SMO Economic Stress Indicator is part of the ETF Portfolio Strategy.
The US SMO Economic Stress Indicator evaluates a wide range of economic indicators.
The architecture is based on a multifactor approach, which combines various components.
Economic indicators analysis
Multi-level big picture analysis:
-
Economic indicators
-
Business Cycle
Action at risk of recession:
-
Reallocate positions to assets that historically outperform during recessions.
If you want to invest and protect your capital, you need more than a buy-and-hold strategy.
You have the opportunity to profit from the ETF Portfolio Strategy. With our service you can copy the strategy.