Review 1999 - 2003 – Dotcom Bubble
From 1997 to 2000, the Dow Jones gained 40%, the Nasdaq Index gained 185% and the Dotcom Index gained almost 1000%. These price increases indicate a clear exaggeration in the technology-heavy Nasdaq and an even stronger exaggeration in the dotcom index, which consisted of 24 stocks.
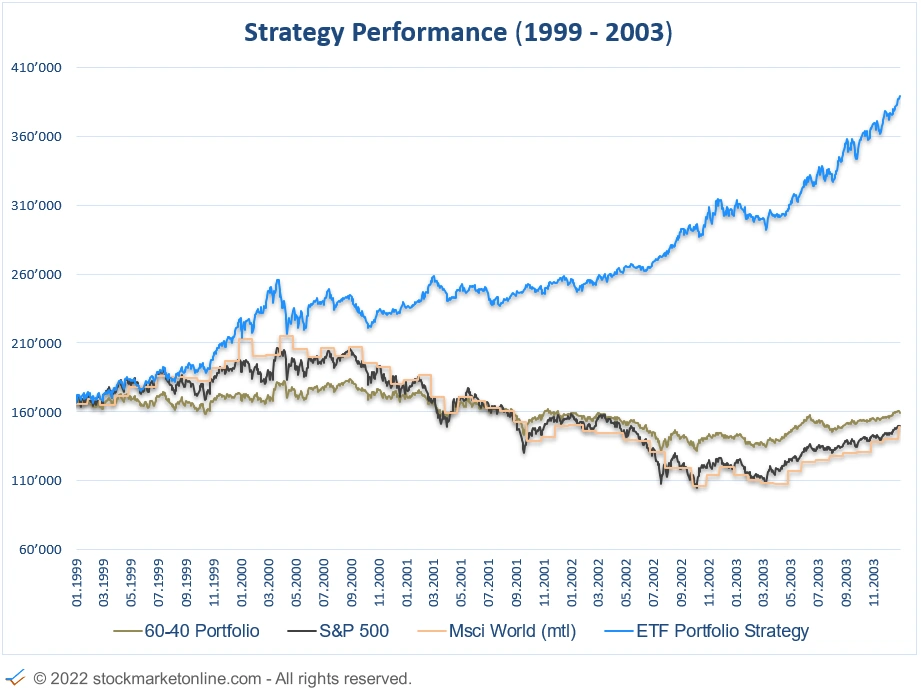
This exaggeration came to an end in March 2000, when the S&P 500 had a P/E valuation of 35. In the following two years, the S&P 500 fell by -49 percent. The Nasdaq index lost -78 percent and the dotcom index fell 95 percent. These figures are impressive. But even more impressive is the performance of the ETF Portfolio Strategy.
In the same period in which the global indices suffered heavy price losses,
the ETF Portfolio Strategy gained more than +25 per cent.
The performance of the ETF Portfolio Strategy differs significantly from the global indices.
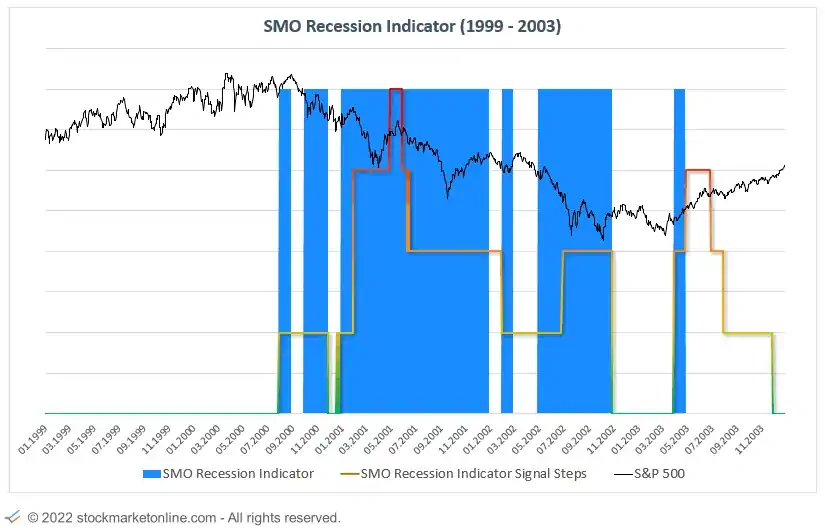
As you can see from the following picture, the ETF Portfolio Strategy also had to struggle with increased volatility in the early months of 2000. However, because this was accompanied by an outperformance of the best indices, we are satisfied with the result.
What are the reasons for the difference in performance?
Recession protection:
-
The US SMO Economic Stress Indicator indicated a possible recession in early 2000.
-
In the event of negative momentum in the stock indices and a signal from the US SMO Economic Stress Indicator, the asset classes are reallocated.
Diversification:
-
Even in a recession, we focus on several asset classes. This ensures diversification even in difficult stock market phases.
Money Management:
-
The ETF Portfolio Strategy regularly calculates the optimal weighting of the individual asset classes.
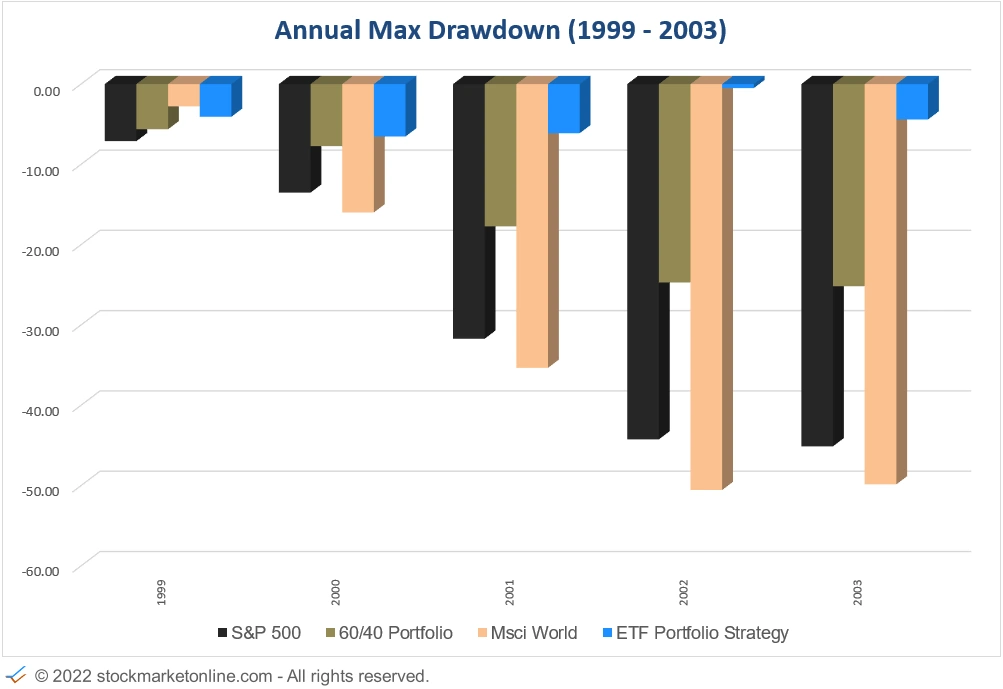
Performance & Drawdown Overview
The strategy is specialized in avoiding risks in the equity market. The investments are selected worldwide and focus on markets and assets that show positive growth.
The long-term outperformance of the global indices is a result of risk management.
Performance: Jan.2000 - Dec. 2002
Drawdowns: Jan.2000 - Dec. 2002
Drawdowns
The following chart shows why avoiding large price declines is so crucial.
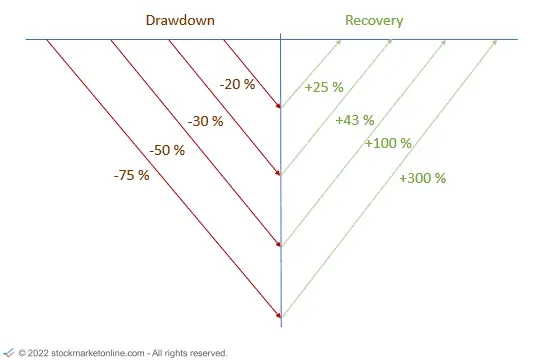
A price loss of 50 percent requires a subsequent price increase of 100 percent to make up for the loss.
Generating high price increases is always a challenge and depends significantly on the performance of the broad equity market.
US SMO Economic Stress Indicator
The US SMO Economic Stress Indicator is an essential component of the ETF Portfolio Strategy.
Risk analysis
The US SMO Economic Stress Indicator has provided three signals in the period 1999 - 2003.
Signal September 1999:
-
In September 1999, a first economic indicator signals possible problems.
Signal March 2000:
-
In March 2000, three leading economic indicators signaled signs of economic problems.