May 22, 2026 a 03:31 pm

PRU: Dividend Analysis - Prudential Financial, Inc.
Prudential Financial, Inc. presents a robust dividend profile with a dividend yield of 5.26%, showcasing its commitment to returning value to shareholders. An uninterrupted 25-year dividend history underlines its reliability, although recent growth rates suggest moderate increases.
📊 Overview
The financial sector remains a stable investment environment, and Prudential Financial, Inc. exemplifies this with a healthy dividend yield of 5.26%. The company has consistently paid dividends for 25 years without any recent cuts or suspensions, indicating a strong, ongoing commitment to dividend sustainability.
| Metric | Value |
|---|---|
| Sector | Financial |
| Dividend yield | 5.257121009367234 % |
| Current dividend per share | 5.47 USD |
| Dividend history | 25 years |
| Last cut or suspension | None |
🗣️ Dividend History
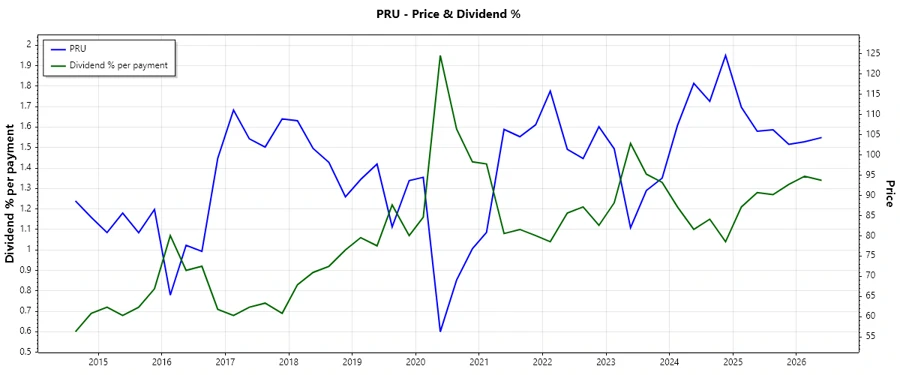
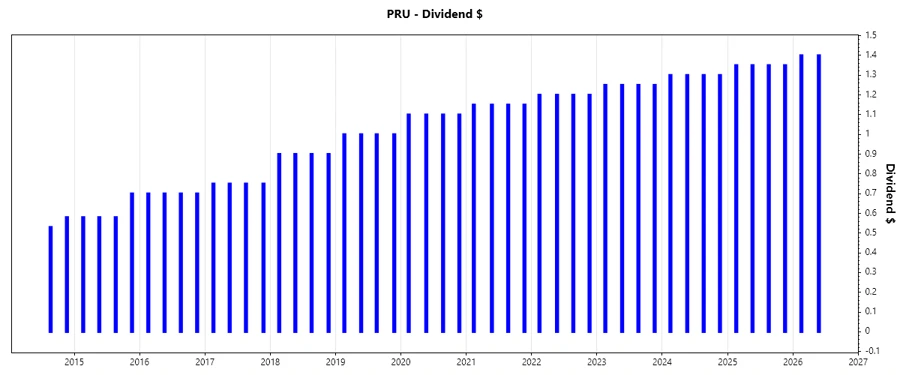
An extensive dividend history is a testament to the company's financial health and its management's dedication to sustaining shareholder returns. The chart and table below illustrate this resilience and the progressive dividend policy of Prudential Financial over the years.
| Year | Dividend per Share (USD) |
|---|---|
| 2026 | 2.8 |
| 2025 | 5.40 |
| 2024 | 5.2 |
| 2023 | 5.00 |
| 2022 | 4.8 |
📈 Dividend Growth
The steady growth in dividends over the years is a positive indicator of the firm's ability to increase shareholder returns. Examining the 3-year and 5-year growth rates provides insights into the company's ongoing commitment to dividend escalation.
| Time | Growth |
|---|---|
| 3 years | 4.00 % |
| 5 years | 4.18 % |
The average dividend growth is 4.18% over 5 years. This shows moderate but steady dividend growth.
📉 Payout Ratio
A payout ratio contextualizes the sustainability of dividends relative to earnings and cash flow. Prudential Financial's payout ratios underscore a disciplined dividend policy supported by earnings and free cash flow.
| Key figure | Ratio |
|---|---|
| EPS-based | 54.92 % |
| Free cash flow-based | 19.43 % |
The EPS payout ratio of 54.92% suggests that Prudential Financial allocates a reasonable portion of its earnings to dividends, whereas the 19.43% FCF ratio reveals a conservative approach, ensuring dividend affordability and sustainability.
✅ Cashflow & Capital Efficiency
Examining cash flow and capital efficiencies gives an overview of Prudential Financial's operational efficiency and its capacity to generate free cash flow, which is vital for sustaining dividends and fueling future growth.
| Key Metric | 2025 | 2024 | 2023 |
|---|---|---|---|
| Free Cash Flow Yield | 15.79 % | 20.06 % | 17.13 % |
| Earnings Yield | 9.00 % | 6.44 % | 6.54 % |
| CAPEX to Operating Cash Flow | 0 % | 0 % | 0 % |
| Stock-based Compensation to Revenue | 0 % | 0 % | 0 % |
| Free Cash Flow / Operating Cash Flow Ratio | 1.00 | 1.00 | 1.00 |
The robust free cash flow yields and disciplined capital expenditure underscore Prudential's effective capital efficiency and its ability to sustain and grow dividends over the long term.
⚠️ Balance Sheet & Leverage Analysis
Analyzing the balance sheet provides insights into Prudential's financial health, liquidity position, and its leverage structure - critical parameters for assessing risk and sustainability of distributions.
| Metric | 2025 | 2024 | 2023 |
|---|---|---|---|
| Debt-to-Equity | 0.708 | 1.018 | 0.968 |
| Debt-to-Assets | 0.0297 | 0.0386 | 0.0373 |
| Debt-to-Capital | 0.414 | 0.504 | 0.492 |
| Net Debt to EBITDA | 0.6607 | 2.747 | 2.502 |
| Current Ratio | 0.609 | 1.866 | 1.803 |
| Quick Ratio | 0.609 | 1.866 | 1.803 |
| Financial Leverage | 23.853 | 26.392 | 25.921 |
The leverage ratios demonstrate Prudential's strategic debt management, with a stable debt-to-equity ratio and improving net debt to EBITDA ratio signifying strong financial stewardship.
📊 Fundamental Strength & Profitability
Fundamental strength and profitability metrics are key to understanding Prudential’s ability to generate returns on equity and assets, spotlighting operational efficiency and effectiveness.
| Metric | 2025 | 2024 | 2023 |
|---|---|---|---|
| Return on Equity | 11.024 % | 9.784 % | 8.943 % |
| Return on Assets | 0.462 % | 0.370 % | 0.345 % |
| Net Margin | 5.884 % | 3.859 % | 4.585 % |
| EBIT Margin | 7.873 % | 4.541 % | 5.661 % |
| EBITDA Margin | 8.084 % | 5.082 % | 5.532 % |
| Gross Margin | 42.041 % | 24.788 % | 32.351 % |
| R&D to Revenue | 0 % | 0 % | 0 % |
The healthy ROE and consistent profit margins indicate Prudential's effective utilization of equity and financial operations to sustain profitability.
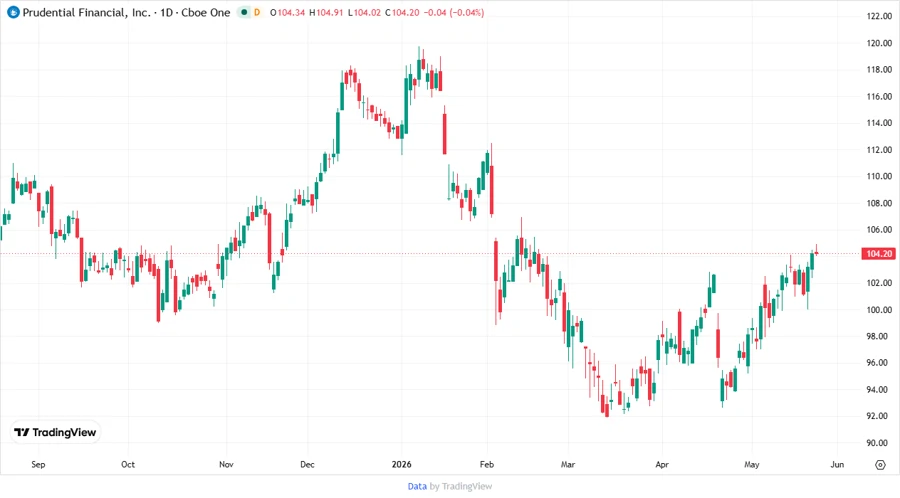
📈 Price Development
🗣️ Dividend Scoring System
| Criteria | Score | Score Bar |
|---|---|---|
| Dividend yield | 4 | |
| Dividend Stability | 5 | |
| Dividend growth | 3 | |
| Payout ratio | 4 | |
| Financial stability | 4 | |
| Dividend continuity | 5 | |
| Cashflow Coverage | 4 | |
| Balance Sheet Quality | 4 |
Total Score: 33/40
🗣️ Rating
With a comprehensive analysis of Prudential Financial, Inc.'s dividend profile and underlying metrics, the overall score of 33/40 suggests a highly reliable and stable dividend-paying stock, suitable for investors seeking consistent income with moderate growth potential.
Smart Data Insight
Master the Perfect Entry & Exit for this Stock
Don't leave your profits to chance. Historically, this stock follows specific seasonal patterns that institutional traders use to maximize returns.
- ✅ Identify the "Golden Buying Window"
- ✅ Avoid high-risk correction cycles
- ✅ Backtested data from the last 20+ years