May 22, 2026 a 11:44 am
MCO: Fibonacci Analysis - Moody's Corporation
Moody's Corporation, with its outstanding credit ratings and analytical tools, plays a crucial role in the financial markets. With a robust global presence across 140 countries and consistently serving institutional participants, the company shows potential for growth. However, like any other equity, its performance is susceptible to market volatility. As it integrates more analytics and software services, it could see enhanced revenue streams. Currently, we're assessing its technical state based on historical price trends.
Fibonacci Analysis
| Aspect | Details |
|---|---|
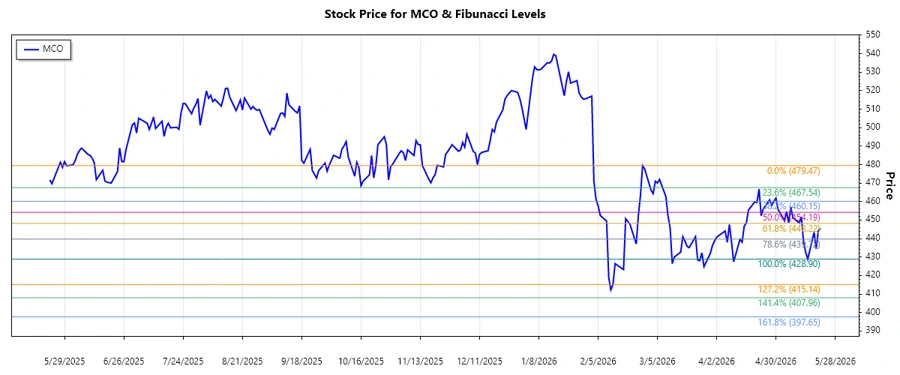
| Trend Start Date | 2026-02-26 |
| Trend End Date | 2026-05-21 |
| Highest Price | $479.47 on 2026-02-26 |
| Lowest Price | $428.9 on 2026-05-15 |
| Current Price | $445.37 on 2026-05-21 |
Fibonacci Levels
| Retracement Level | Price |
|---|---|
| 0.236 | $440.35 |
| 0.382 | $447.28 |
| 0.500 | $454.19 |
| 0.618 | $461.10 |
| 0.786 | $469.56 |
The current price of $445.37 is within the 0.236 to 0.382 Fibonacci retracement level, suggesting a possible consolidation phase. Technically, this zone might act as a support, potentially halting further losses or signaling a time for accumulation among traders.
Conclusion
Moody's Corporation's current technical positioning reveals the potential for both upward momentum should support hold, or a downturn if the market sentiment shifts negatively. Its worldwide operations and expansion into diverse analytical tools can be both an opportunity and a risk depending on economic conditions. Analysts should watch for movements beyond the 0.382 retracement to confirm any trend reversals. Given the volatile market environment, the focus should remain on both broader economic indicators and Moody’s strategic responses.
Smart Data Insight
Master the Perfect Entry & Exit for this Stock
Don't leave your profits to chance. Historically, this stock follows specific seasonal patterns that institutional traders use to maximize returns.
- ✅ Identify the "Golden Buying Window"
- ✅ Avoid high-risk correction cycles
- ✅ Backtested data from the last 20+ years