May 19, 2026 a 04:28 am
EURJPY: Trend and Support & Resistance Analysis
EURJPY exhibits interesting technical patterns, demonstrating both challenges and opportunities for traders. Monitoring these patterns is vital for making informed trading decisions. The current analysis provides a comprehensive look into trend movements and key price zones.
Trend Analysis
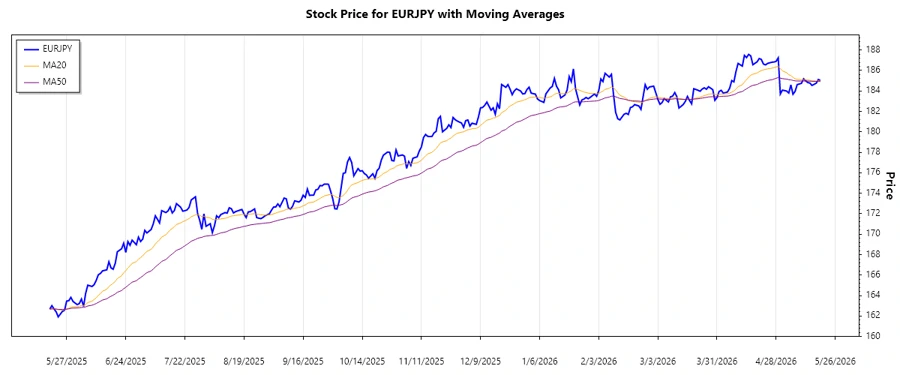
The following trend analysis is conducted by calculating EMA20 and EMA50 from the historical price data to determine short to medium-term trends. The Exponential Moving Averages suggest potential market directions that aid technical trading.
| Date | Closing Price | Trend |
|---|---|---|
| 2026-05-19 | 185.023 | ▲ |
| 2026-05-18 | 185.117 | ▲ |
| 2026-05-17 | 184.755 | ▲ |
| 2026-05-15 | 184.535 | ▲ |
| 2026-05-14 | 184.767 | ▲ |
| 2026-05-13 | 184.822 | ▲ |
| 2026-05-12 | 184.984 | ▲ |
The analysis of EMA suggests an ongoing uptrend, highlighting potentially bullish sentiment. Careful observation of the moving averages can assist in decision-making regarding buy or hold strategies.
Support and Resistance
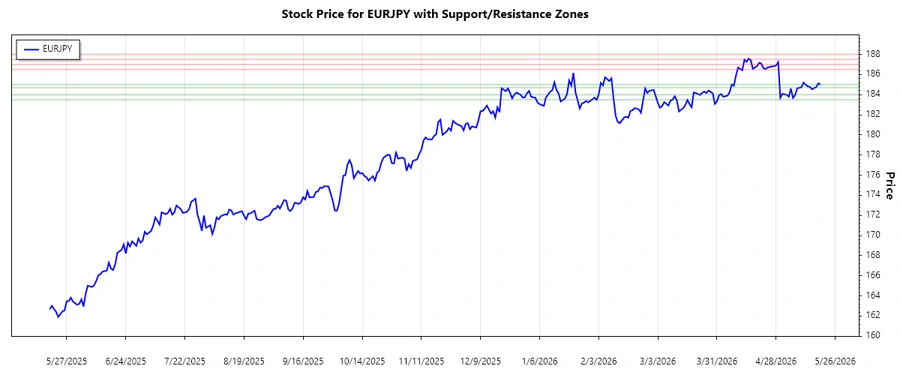
Identifying support and resistance zones is crucial for investors to strategize their entry and exit points based on market behavior.
| Zone Type | From | To |
|---|---|---|
| Support | 183.50 | 184.00 |
| Support | 184.70 | 185.00 |
| Resistance | 186.50 | 187.00 |
| Resistance | 187.50 | 188.00 |
The current price is situated within a support zone, suggesting the potential for an upward move. Observing these zones can provide strategic points for trade execution.
Conclusion
The EURJPY pair shows signs of a slight bullish trend, indicating a promising outlook for buyers. However, traders should remain cautious of resistance levels that could challenge an uptrend continuation. As fluctuations are inherent, it's important to align technical insights with broader economic indicators before committing to trades. Analysts can gain valuable insights, assisting in making astute trading decisions.
Smart Data Insight
Master the Perfect Entry & Exit for this Stock
Don't leave your profits to chance. Historically, this stock follows specific seasonal patterns that institutional traders use to maximize returns.
- ✅ Identify the "Golden Buying Window"
- ✅ Avoid high-risk correction cycles
- ✅ Backtested data from the last 20+ years