May 23, 2026 a 02:46 am
NUE: Dividend Analysis - Nucor Corporation
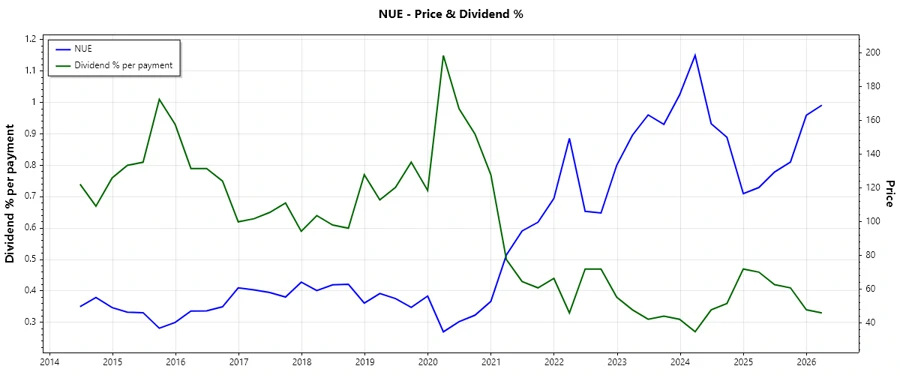
Nucor Corporation presents a compelling dividend profile with a consistent history of payments over 44 years. With a modest dividend yield of 1.31% combined with steady growth, the company stands out as a stable choice in the steel sector, suitable for investors seeking reliability over immediate high returns. The company shows a cautious yet progressive strategy towards reward distribution, enhancing shareholder value.
📊 Overview
Nucor Corporation, a leader in the steel sector, offers a dividend profile with a yield of 1.31%. The current dividend per share stands at USD 2.22. With an impressive history of uninterrupted dividend payments spanning 44 years, Nucor has maintained investor confidence. Importantly, there has been no recent cut or suspension in dividends.
| Metric | Value |
|---|---|
| Sector | Steel |
| Dividend yield | 1.31% |
| Current dividend per share | 2.22 USD |
| Dividend history | 44 years |
| Last cut or suspension | None |
📈 Dividend History
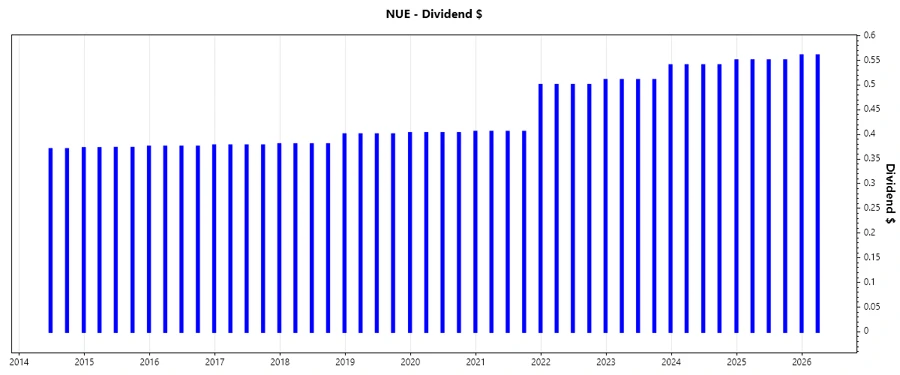
The dividend history of Nucor Corporation highlights its long-term commitment to investors, with 44 years of consistent payouts. This track record is a testament to the company's financial health and resilience, ensuring investor confidence in varying market conditions.
| Year | Dividend Per Share (USD) |
|---|---|
| 2026 | 0.56 |
| 2025 | 2.21 |
| 2024 | 2.17 |
| 2023 | 2.07 |
| 2022 | 2.01 |
📊 Dividend Growth
Examining the dividend growth reveals a progressive increase of 3.21% over the last three years and 6.51% over five years. This growth pattern indicates a solid foundation for long-term investors and reflects the company's capacity to enhance shareholder value consistently.
| Time | Growth |
|---|---|
| 3 years | 3.21% |
| 5 years | 6.51% |
The average dividend growth is 6.51% over 5 years. This shows moderate but steady dividend growth.
📉 Payout Ratio
The payout ratio acts as a crucial indicator of the sustainability of dividend payments relative to earnings. Nucor Corporation's EPS payout ratio of 21.79% coupled with an FCF payout ratio of 95.01% underscores its judicious approach.
| Key Figure | Ratio |
|---|---|
| EPS-based | 21.79% |
| Free cash flow-based | 95.01% |
The low payout ratio based on EPS suggests a robust buffer for reinvestment or increased payouts, though the high FCF payout may indicate tight cash management practices.
✅ Cashflow & Capital Efficiency
Effective cash flow management is vital for sustaining dividend payments and strategic expansion. Nucor demonstrates a consistent earnings yield and prudent capital expenditure relative to operating cash flow, indicating efficient capital allocation.
| Year | 2023 | 2024 | 2025 |
|---|---|---|---|
| Free Cash Flow Yield | 11.27% | 2.90% | -0.50% |
| Earnings Yield | 10.41% | 7.29% | 4.63% |
| CAPEX to Operating Cash Flow | 31.13% | 79.74% | 105.81% |
| Stock-based Compensation to Revenue | 0.37% | 0.43% | 0.41% |
| Free Cash Flow / Operating Cash Flow Ratio | 68.87% | 20.26% | -5.81% |
The cash flow figures suggest a company capable of managing operational and capital demands efficiently, though the rising CAPEX-to-Operating Cash Flow ratio might require monitoring.
⚠️ Balance Sheet & Leverage Analysis
Nucor’s leverage ratios provide insight into its financial structure and risk. With manageable debt-to-equity and robust interest coverage, the company shows a solid foundation for sustaining growth.
| Year | 2023 | 2024 | 2025 |
|---|---|---|---|
| Debt-to-Equity | 0.33 | 0.34 | 0.34 |
| Debt-to-Assets | 0.19 | 0.20 | 0.20 |
| Debt-to-Capital | 0.25 | 0.26 | 0.25 |
| Net Debt to EBITDA | 0.06 | 0.76 | 1.18 |
| Current Ratio | 3.57 | 2.51 | 2.94 |
| Quick Ratio | 2.35 | 1.48 | 1.57 |
| Financial Leverage | 1.69 | 1.67 | 1.68 |
Overall, Nucor maintains a stable balance sheet with adequate liquidity and leverage, though some fluctuations in liquidity measures warrant consistent oversight.
🗣️ Fundamental Strength & Profitability
Profitability indicators are key metrics reflecting a company's operational efficiency and competitive edge. Nucor's return measures and margin ratios show solid profitability and prudent cost management.
| Year | 2023 | 2024 | 2025 |
|---|---|---|---|
| Return on Equity | 21.61% | 9.99% | 8.33% |
| Return on Assets | 12.80% | 5.97% | 4.97% |
| Margins: Net | 13.03% | 6.60% | 5.37% |
| EBIT | 18.78% | 10.18% | 8.08% |
| EBITDA | 22.15% | 14.60% | 12.64% |
| Gross | 22.51% | 13.35% | 11.93% |
| R&D to Revenue | 0% | 0% | 0% |
Nucor has displayed strong profitability, though the decline in return metrics over recent years necessitates a continued focus on cost management and innovation.
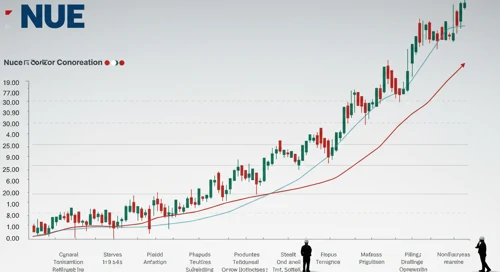
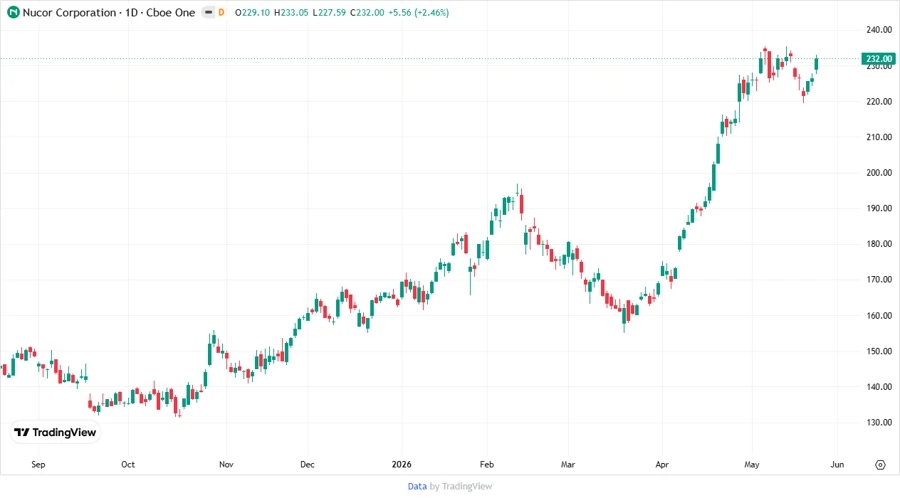
📊 Price Development
Dividend Scoring System
| Criterion | Score | Graph |
|---|---|---|
| Dividend yield | 3 | |
| Dividend Stability | 5 | |
| Dividend growth | 4 | |
| Payout ratio | 3 | |
| Financial stability | 4 | |
| Dividend continuity | 5 | |
| Cashflow Coverage | 3 | |
| Balance Sheet Quality | 4 |
Total Score: 31 / 40
Rating
Nucor Corporation exhibits a strong dividend profile with consistent growth and stability. The company’s balanced payout ratio and robust financial structure suggest a reliable investment for risk-averse dividend seekers. It stands as a favorable candidate within the steel industry for building a diversified income portfolio, with a cautiously optimistic outlook for future dividends.
Smart Data Insight
Master the Perfect Entry & Exit for this Stock
Don't leave your profits to chance. Historically, this stock follows specific seasonal patterns that institutional traders use to maximize returns.
- ✅ Identify the "Golden Buying Window"
- ✅ Avoid high-risk correction cycles
- ✅ Backtested data from the last 20+ years