May 17, 2026 a 05:08 am
GBPUSD: Fibonacci Analysis
The GBPUSD currency pair has experienced significant fluctuations in recent months, influenced by economic policies and market sentiment. The recent trend suggests a moderate recovery, with attention focused on upcoming economic data releases. Investors should closely monitor key support and resistance levels for potential trading opportunities.
Fibonacci Analysis
| Information | Details |
|---|---|
| Start Date | 2026-02-01 |
| End Date | 2026-05-15 |
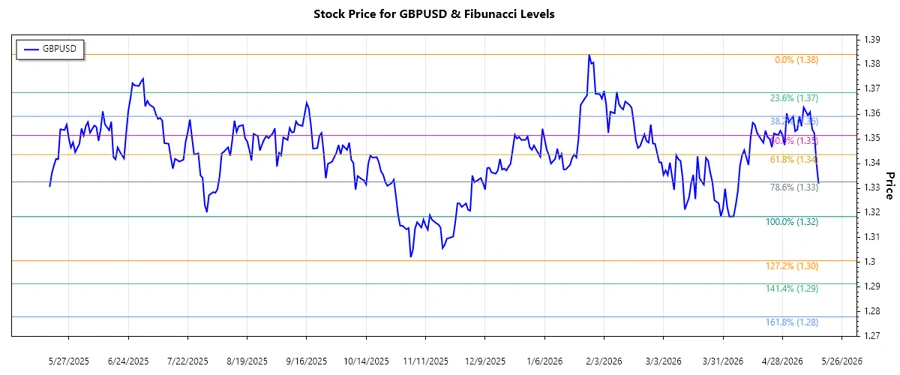
| High Price | $1.38422 (2026-01-27) |
| Low Price | $1.31851 (2026-04-03) |
| Fibonacci Level | Price |
|---|---|
| 0.236 | $1.33213 |
| 0.382 | $1.34323 |
| 0.5 | $1.35136 |
| 0.618 | $1.35949 |
| 0.786 | $1.37188 |
Current Price Level: At 0.5 retracement level
Interpretation: The current GBPUSD price is at the 0.5 Fibonacci retracement level, indicating a potential area of support. Traders and analysts should monitor this level for possible price reversals or consolidations.
Conclusion
The GBPUSD analysis using Fibonacci retracement levels points to significant areas of interest where potential price reversals may occur. The present alignment at the 0.5 retracement level suggests a key support zone that could stabilize the currency pair in the near term. While bullish momentum may continue if support holds, a breach below could lead to a deeper correction. Market participants should exercise caution and leverage technical indicators alongside economic data to make informed decisions.
Smart Data Insight
Master the Perfect Entry & Exit for this Stock
Don't leave your profits to chance. Historically, this stock follows specific seasonal patterns that institutional traders use to maximize returns.
- ✅ Identify the "Golden Buying Window"
- ✅ Avoid high-risk correction cycles
- ✅ Backtested data from the last 20+ years