May 21, 2026 a 04:28 am
AUDJPY: Trend and Support & Resistance Analysis
The AUDJPY currency pair has shown significant fluctuations over the past few months, reflecting both global economic factors and regional influences. As we analyze the technical indicators, there are clear trends that have emerged, alongside key support and resistance levels. This analysis aims to provide a comprehensive understanding of these patterns and their implications for currency traders.
Trend Analysis
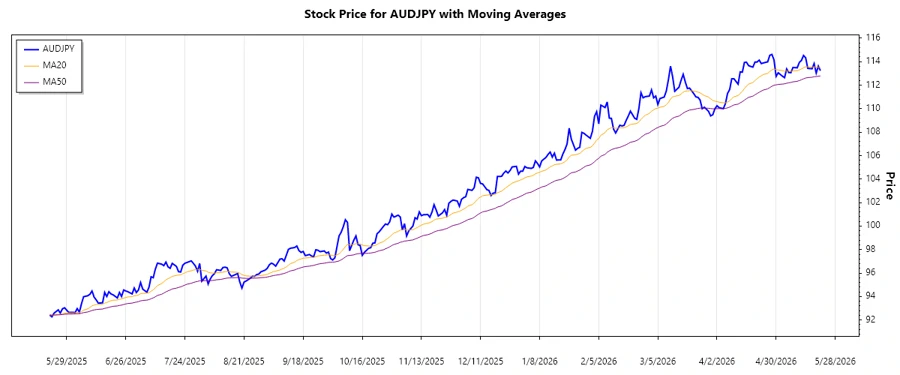
Based on the recent daily closing prices, the AUDJPY pair displays a defined trend that aligns with global market conditions. Calculating the Moving Averages offers insights into the short-term sentiment.
| Date | Closing Price | Trend Indicator |
|---|---|---|
| 2026-05-21 | 113.225 | ⚖️ |
| 2026-05-20 | 113.619 | ▲ |
| 2026-05-19 | 113.024 | ▼ |
| 2026-05-18 | 113.838 | ▲ |
| 2026-05-17 | 113.391 | ⚖️ |
| 2026-05-15 | 113.428 | ⚖️ |
| 2026-05-14 | 114.326 | ▲ |
The trend indicator shows alternating movements which suggest potential market indecision. Monitoring moving averages can clarify the predominant trend direction.
Support and Resistance
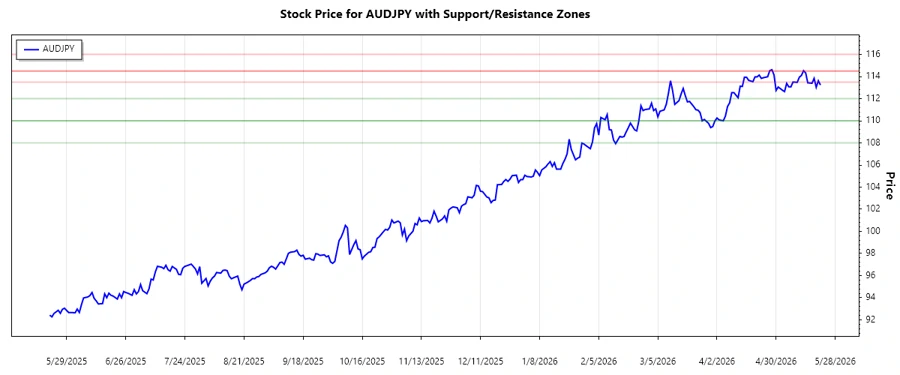
Analysis of closing prices reveals the following support and resistance zones indicating potential buy and sell triggers.
| Zone Type | From | To |
|---|---|---|
| Support | 110.00 | 112.00 |
| Support | 108.00 | 110.00 |
| Resistance | 114.50 | 116.00 |
| Resistance | 113.50 | 114.50 |
The current closing price suggests the AUDJPY sits within the support zone of 112.00 to 113.00, offering a potential opportunity for bullish reversals.
Conclusion
In conclusion, the AUDJPY pair exhibits stability but remains reactive to market shifts. The emerging support and resistance levels provide critical insights for traders to time their entries and exits effectively. However, the relatively neutral EMA analysis suggests cautious observation for trend confirmations. Analysts should be mindful of macroeconomic factors that could disrupt these technical patterns.
Smart Data Insight
Master the Perfect Entry & Exit for this Stock
Don't leave your profits to chance. Historically, this stock follows specific seasonal patterns that institutional traders use to maximize returns.
- ✅ Identify the "Golden Buying Window"
- ✅ Avoid high-risk correction cycles
- ✅ Backtested data from the last 20+ years