
May 22, 2026 a 07:31 am

WFC: Dividend Analysis - Wells Fargo & Company
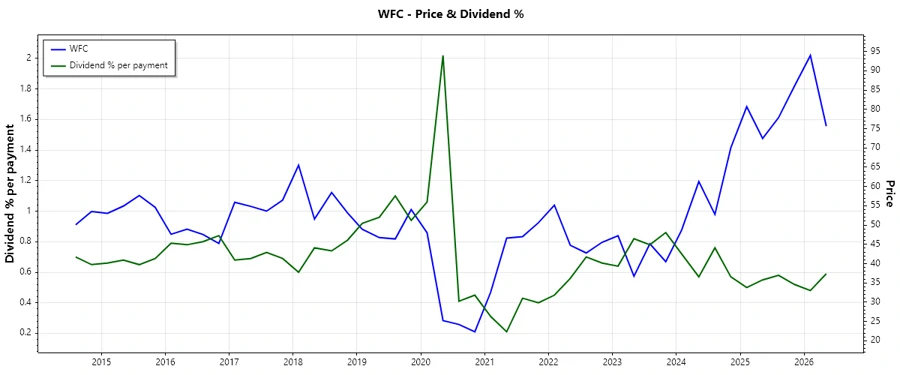
Wells Fargo & Company offers investors a modest dividend yield with a stable dividend history. Its dividend growth is moderate yet consistent, reflecting a strong financial foundation that underscores its ability to reward shareholders steadily over time. However, its current payout ratios signal a need for cautious optimism, as the free cash flow payout is disproportionately high.
📊 Overview
Wells Fargo & Company operates in the financial sector, offering a dividend yield of 2.38%. The current dividend per share stands at 2.04 USD. With a dividend history spanning 55 years and no recent cuts or suspensions, the firm has demonstrated a reliable commitment to its dividend strategy, indicative of robust corporate governance and fiscal prudence.
| Metric | Value |
|---|---|
| Sector | Financials |
| Dividend Yield | 2.38% |
| Current Dividend Per Share | 2.04 USD |
| Dividend History | 55 years |
| Last Cut or Suspension | None |
📉 Dividend History
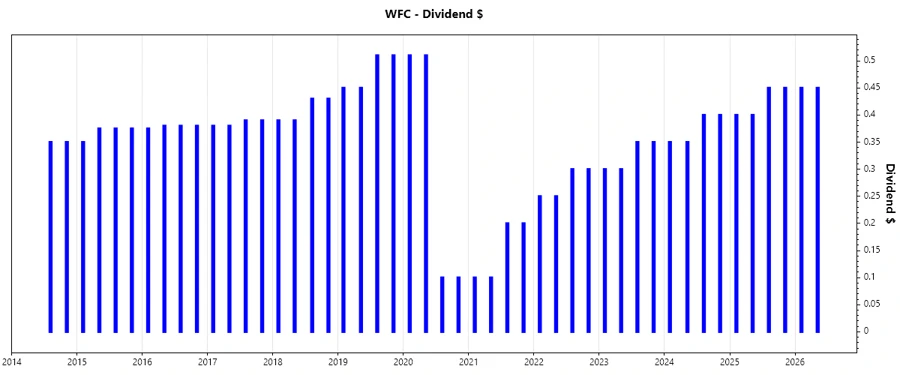
The significance of Wells Fargo's extensive dividend history lies in its stability and reliability, making it an attractive prospect for dividend-seeking investors. A history of steady payouts reflects a resilient business model capable of withstanding economic cycles.
| Year | Dividend Per Share (USD) |
|---|---|
| 2026 | 0.90 |
| 2025 | 1.70 |
| 2024 | 1.50 |
| 2023 | 1.30 |
| 2022 | 1.10 |
📈 Dividend Growth
Understanding dividend growth is crucial as it reflects the company's decision-making in reward distribution versus reinvestment. A healthy growth rate signals ongoing profitability and shareholder value enhancement.
| Time | Growth |
|---|---|
| 3 years | 15.62% |
| 5 years | 6.86% |
The average dividend growth is 6.86% over 5 years. This shows moderate but steady dividend growth.
💸 Payout Ratio
Payout ratios are indicative of how much earnings are returned to shareholders as dividends. A balanced payout ratio demonstrates a company's operational strength and ability to sustain its dividends over time.
| Key Figure | Ratio |
|---|---|
| EPS-based | 29.83% |
| Free cash flow-based | 529.39% |
While the EPS-based payout of 29.83% is manageable, the free cash flow payout of 529.39% highlights potential concerns over the quality of earnings and cash conservation capabilities.
💼 Cashflow & Capital Efficiency
Effective cash flow management enhances a company's ability to maintain dividends and reinvest in growth opportunities. Key performance indicators reflect its financial flexibility and capital allocation efficiency.
| Metrics (Year) | 2025 | 2024 | 2023 |
|---|---|---|---|
| Free Cash Flow Yield | -6.41% | 1.26% | 22.23% |
| Earnings Yield | 7.20% | 8.20% | 10.54% |
| CAPEX to Operating Cash Flow | 0% | 0% | 0% |
| Stock-based Compensation to Revenue | 0% | 0% | 0% |
| Free Cash Flow / Operating Cash Flow Ratio | 1 | 1 | 1 |
Though earnings yield shows profitability, fluctuations in free cash flow yield suggest varying cash inflow stability, impacting capital reinvestment potential.
📊 Balance Sheet & Leverage Analysis
A strong balance sheet ensures financial solvency and mitigates risks associated with economic downturns. Assessing leverage provides insights into liabilities relative to equity and assets.
| Metrics (Year) | 2025 | 2024 | 2023 |
|---|---|---|---|
| Debt-to-Equity | 2.35 | 1.57 | 1.60 |
| Debt-to-Assets | 19.81% | 14.61% | 15.38% |
| Debt-to-Capital | 70.15% | 61.15% | 61.54% |
| Net Debt to EBITDA | 8.73 | 2.54 | 2.15 |
| Current Ratio | 28.71% | 27.41% | 28.76% |
| Quick Ratio | 28.71% | 27.41% | 28.76% |
| Financial Leverage | 11.86 | 10.77 | 10.40 |
High leverage ratios indicate significant debt levels, signaling potential risks if income fluctuates, requiring vigilant financial management to maintain long-term viability.
🌟 Fundamental Strength & Profitability
Strong fundamental metrics reflect a company's ability to generate earnings and maintain margins essential for sustainable dividend policies and reinvestment strategies.
| Metrics (Year) | 2025 | 2024 | 2023 |
|---|---|---|---|
| Return on Equity | 11.78% | 11.01% | 10.31% |
| Return on Assets | 0.99% | 1.02% | 0.99% |
| Margins: Net | 17.27% | 15.73% | 16.60% |
| Margins: EBIT | 20.40% | 18.63% | 18.76% |
| Margins: EBITDA | 23.76% | 24.66% | 24.20% |
| Margins: Gross | 64.80% | 62.17% | 66.93% |
| Research & Development to Revenue | 0% | 0% | 0% |
Wells Fargo's steady return rates and profit margins highlight effective cost management, bolstering its capacity to enhance shareholder value through consistent profitability.
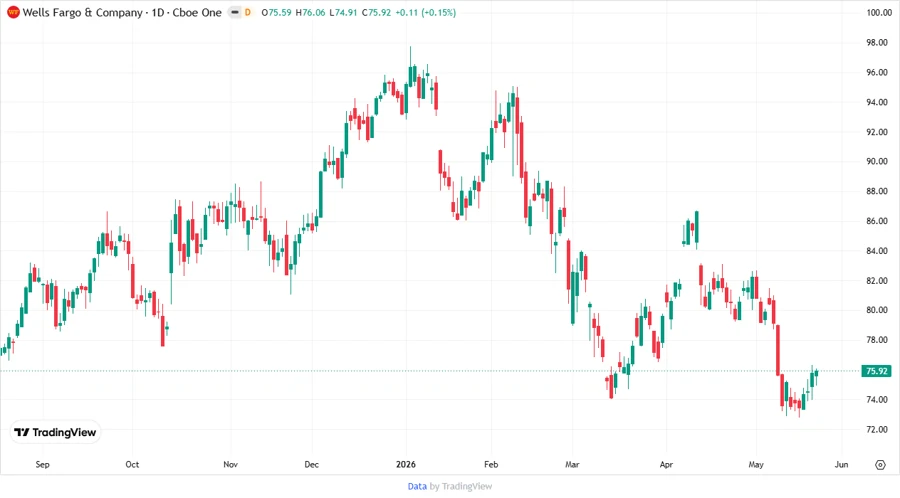
📈 Price Development
Dividend Scoring System
| Metric | Score (1-5) | Score Bar |
|---|---|---|
| Dividend Yield | 3 | |
| Dividend Stability | 5 | |
| Dividend Growth | 3 | |
| Payout Ratio | 2 | |
| Financial Stability | 3 | |
| Dividend Continuity | 5 | |
| Cashflow Coverage | 2 | |
| Balance Sheet Quality | 3 |
Total Score: 26/40
💡 Rating
Wells Fargo & Company offers a robust dividend profile with lengthy stability and moderate growth, appealing to income-focused investors. However, its high free cash flow payout ratio necessitates a cautious approach, as operational consistency may require adjustments to sustain dividend distributions under financial constraints. Investors should weigh these factors carefully in alignment with their broader portfolio strategy.
Smart Data Insight
Master the Perfect Entry & Exit for this Stock
Don't leave your profits to chance. Historically, this stock follows specific seasonal patterns that institutional traders use to maximize returns.
- ✅ Identify the "Golden Buying Window"
- ✅ Avoid high-risk correction cycles
- ✅ Backtested data from the last 20+ years