May 22, 2026 a 04:44 pm
MMC: Fibonacci Analysis - Marsh & McLennan Companies, Inc.
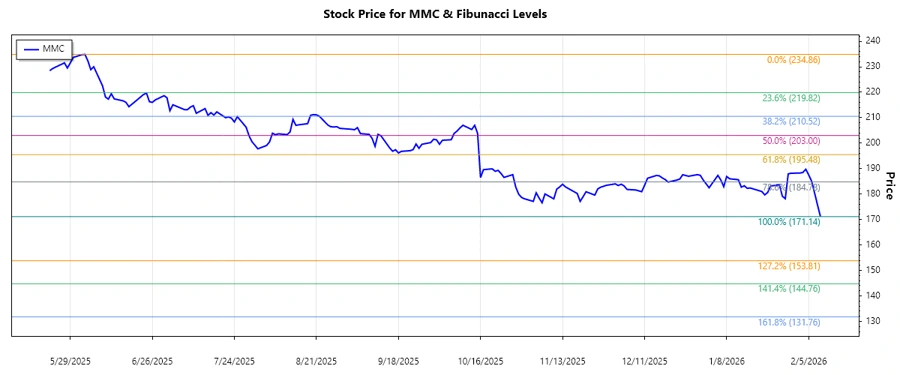
Marsh & McLennan Companies, Inc. has shown resilience in turbulent markets thanks to its robust business model focusing on professional services in risk and insurance services. However, recent data indicates a downward trend. This analysis will cover the potential retracement levels based on the recent bearish movement in prices.
Fibonacci Analysis
| Aspect | Details |
|---|---|
| Trend Analysis Period | 2025-05-22 to 2026-02-09 |
| High Point | $234.86 on 2025-06-03 |
| Low Point | $171.14 on 2026-02-09 |
| Current Price | $171.14 |
| Fibonacci Level | Price Level |
|---|---|
| 0.236 | $186.73 |
| 0.382 | $195.13 |
| 0.5 | $203.00 |
| 0.618 | $210.86 |
| 0.786 | $221.02 |
Currently, the stock price of $171.14 is below the 0.236 Fibonacci retracement level.
This suggests potential support at these levels; however, current levels indicate bearish strength, likely continuing the downtrend unless a strong reversal is observed.
Conclusion
Marsh & McLennan Companies, Inc. is currently experiencing a significant downward trend, requiring careful consideration of potential reversal or continuing decline. The risk lies in a persisting downtrend, making investor caution paramount. Wise investors may await confirmation of significant support confirmation or bullish reversal signals before making further commitments. Technical indicators suggest vigilance at critical Fibonacci levels for potential market re-entries.
Smart Data Insight
Master the Perfect Entry & Exit for this Stock
Don't leave your profits to chance. Historically, this stock follows specific seasonal patterns that institutional traders use to maximize returns.
- ✅ Identify the "Golden Buying Window"
- ✅ Avoid high-risk correction cycles
- ✅ Backtested data from the last 20+ years