May 22, 2026 a 04:03 am
MMC: Trend and Support & Resistance Analysis - Marsh & McLennan Companies, Inc.
Marsh & McLennan Companies, Inc. (Ticker: MMC) provides critical services in risk management and consulting, creating expertise-driven value for its broad clientele. Recently, the stock has shown volatility with key support and resistance levels shaping market sentiment. Investors should closely monitor these technical zones as they provide insights into potential future price movements, backed by robust business operations in risk and consulting sectors.
Trend Analysis
| Date | Closing Price | Trend |
|---|---|---|
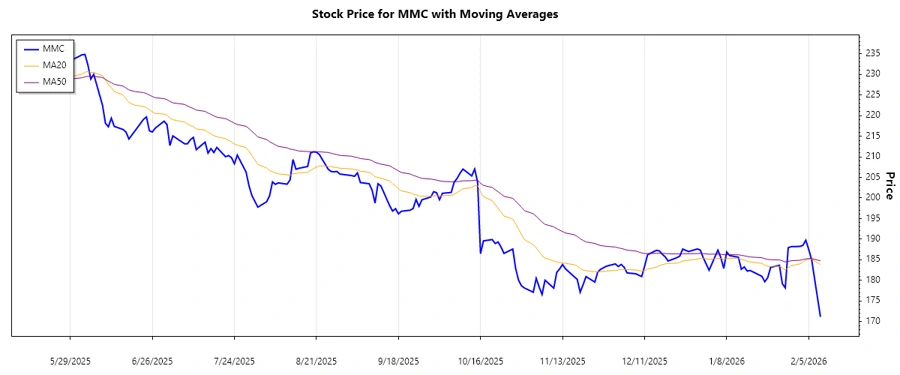
| 2026-02-09 | $171.14 | ▼ |
| 2026-02-06 | $185.03 | ▼ |
| 2026-02-05 | $187.51 | ▼ |
| 2026-02-04 | $189.75 | ▼ |
| 2026-02-03 | $188.49 | ▼ |
| 2026-02-02 | $188.25 | ▼ |
| 2026-01-30 | $188.19 | ▼ |
Based on our analysis with EMA20 and EMA50, the trend is a clear ▼ downtrend. The stock is currently under selling pressure, suggesting caution for investors.
Support and Resistance
| Support/Resistance | Zone From | Zone To |
|---|---|---|
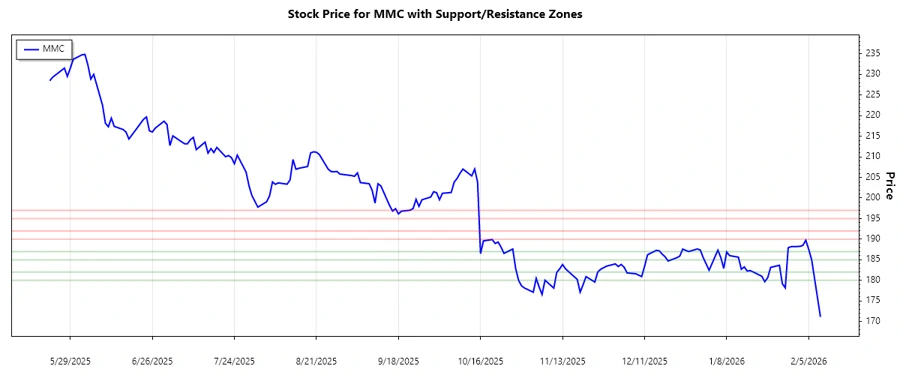
| Support 1 | 185.00 | 187.00 |
| Support 2 | 180.00 | 182.00 |
| Resistance 1 | 190.00 | 192.00 |
| Resistance 2 | 195.00 | 197.00 |
Currently, the stock is trading below its support zone, emphasizing its bearish trend. This could indicate further downward pressure unless reversed by market forces.
Conclusion
Marsh & McLennan Companies, Inc.'s stock is presently in a declining phase, as indicated by the ongoing downtrend. The breach of support zones hints at possible further declines, requiring investor vigilance. However, the company's strong market position and diversified services within risk management and consulting provide a foundation for potential recovery in favorable conditions. Technical analysis supports cautionary tactics for short-term investors, while long-term holders might focus on the company’s intrinsic strengths.
Smart Data Insight
Master the Perfect Entry & Exit for this Stock
Don't leave your profits to chance. Historically, this stock follows specific seasonal patterns that institutional traders use to maximize returns.
- ✅ Identify the "Golden Buying Window"
- ✅ Avoid high-risk correction cycles
- ✅ Backtested data from the last 20+ years