May 22, 2026 a 05:08 am
USDJPY: Fibonacci Analysis
The USDJPY currency pair has demonstrated resilience in recent months, showcasing a strong uptrend as it reached a significant high. The market shows bullish tendencies, driven by strong economic fundamentals and investor confidence. Traders should be watchful of potential retracement levels after this aggressive upward movement. The upward momentum, however, can face resistance, testing the integrity of the prevailing trend.
Fibonacci Analysis
| Description | Data |
|---|---|
| Trend Start Date | 2026-02-22 |
| Trend End Date | 2026-05-22 |
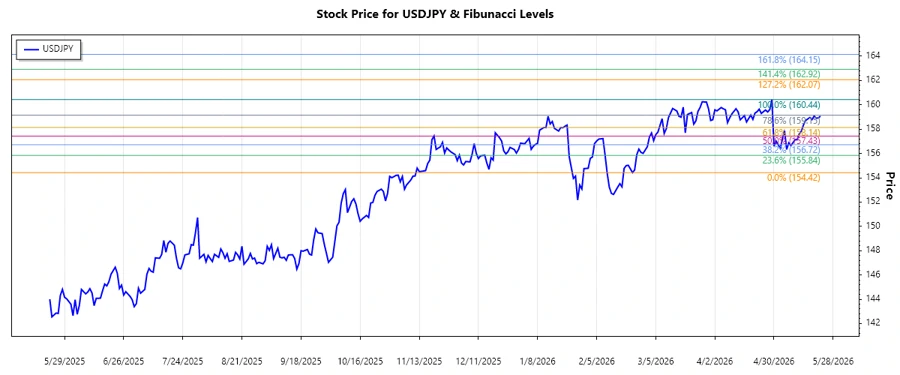
| High Point | 160.435 on 2026-04-29 |
| Low Point | 154.421 on 2026-02-22 |
| Fibonacci Levels |
|
| Current Price and Retracement | The current price is 159.07, which is within the 0.786 retracement level. |
| Interpretation | If the price consolidates at the 0.786 level, it suggests a strong support zone, inviting bullish momentum for continuation of the upward trend. |
Conclusion
The USDJPY has been on a robust uptrend, and the recent analysis of Fibonacci retracement levels suggests key support areas. Current levels are favorable for bulls, but caution is warranted if downside risk becomes apparent. Technical analysts should observe whether the market sustains this levels for potential bullish movement. Although opportunities exist for further price rallies, global economic changes or policy impacts could present challenges. All eyes will be on upcoming financial reports that could act as catalysts for significant market movement. Continuous monitoring is essential for capturing favorable entry or exit points for positions.
Smart Data Insight
Master the Perfect Entry & Exit for this Stock
Don't leave your profits to chance. Historically, this stock follows specific seasonal patterns that institutional traders use to maximize returns.
- ✅ Identify the "Golden Buying Window"
- ✅ Avoid high-risk correction cycles
- ✅ Backtested data from the last 20+ years