May 16, 2026 a 04:28 am
EURGBP: Trend and Support & Resistance Analysis
The EURGBP pair has recently shown fluctuations, reflecting both market volatility and opportunities for traders. Over the last month, we observed a trend shift triggered by economic events in Europe and the UK that have provided mixed signals for investors. Currently, the pair's dynamics suggest a nuanced approach considering both long-term and short-term indicators. The provided analysis focuses on identifying major trends and key support and resistance zones to help navigate upcoming market behaviors.
Trend Analysis
| Date | Closing Price | Trend |
|---|---|---|
| 2026-05-15 | 0.87225 | ▲ |
| 2026-05-14 | 0.87068 | ▲ |
| 2026-05-13 | 0.86601 | ▼ |
| 2026-05-12 | 0.86696 | ▼ |
| 2026-05-11 | 0.86569 | ▼ |
| 2026-05-10 | 0.86557 | ▼ |
| 2026-05-08 | 0.86442 | ▼ |
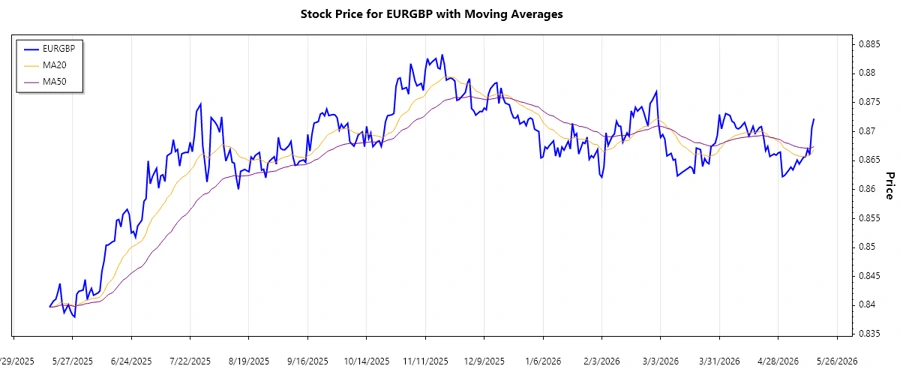
Based on the EMA calculations, a downward trend is evident as the EMA20 remains below the EMA50. Traders should consider the ongoing downward pressure when evaluating entry and exit strategies.
Support- and Resistance
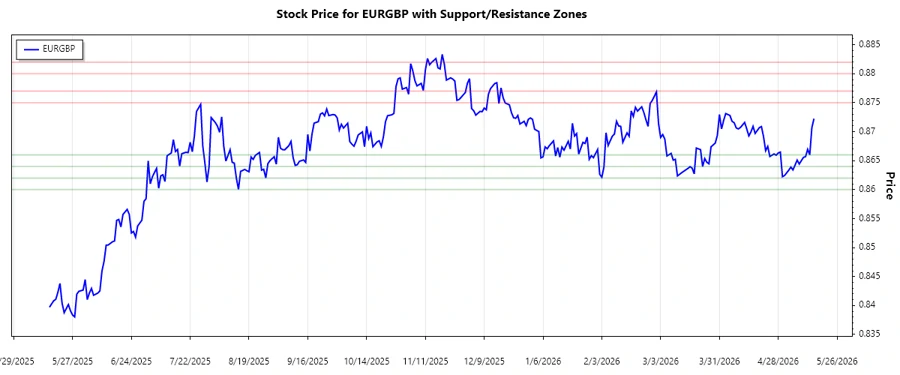
Data analysis identifies critical support and resistance levels for EURGBP:
| Zone Type | Zone Details |
|---|---|
| Support | From 0.8640 to 0.8660 ▼ |
| Support | From 0.8600 to 0.8620 ▼ |
| Resistance | From 0.8750 to 0.8770 ▲ |
| Resistance | From 0.8800 to 0.8820 ▲ |
The current price close to the lower support zone indicates a potential rebound, although traders should consider the broader market context.
Conclusion
The EURGBP currency pair is experiencing a downward trend, and it is vital for traders to monitor the support and resistance levels closely. The presence of the price in a key support zone suggests opportunity for reversal, albeit with cautious market outlook due to prevailing volatility. Analysts should consider the impact of macroeconomic factors in Europe and the UK, which significantly influence this pair's trajectory. For those seeking opportunities, understanding the pattern while maintaining risk management will be crucial. Current conditions reflect both risks of continued depreciation and potential for reactive rebounds. Sensitivity to upcoming economic indications and global market trends will likely dictate future movements.
Smart Data Insight
Master the Perfect Entry & Exit for this Stock
Don't leave your profits to chance. Historically, this stock follows specific seasonal patterns that institutional traders use to maximize returns.
- ✅ Identify the "Golden Buying Window"
- ✅ Avoid high-risk correction cycles
- ✅ Backtested data from the last 20+ years