May 22, 2026 a 06:01 pm
AVY: Fundamental Ratio Analysis - Avery Dennison Corporation
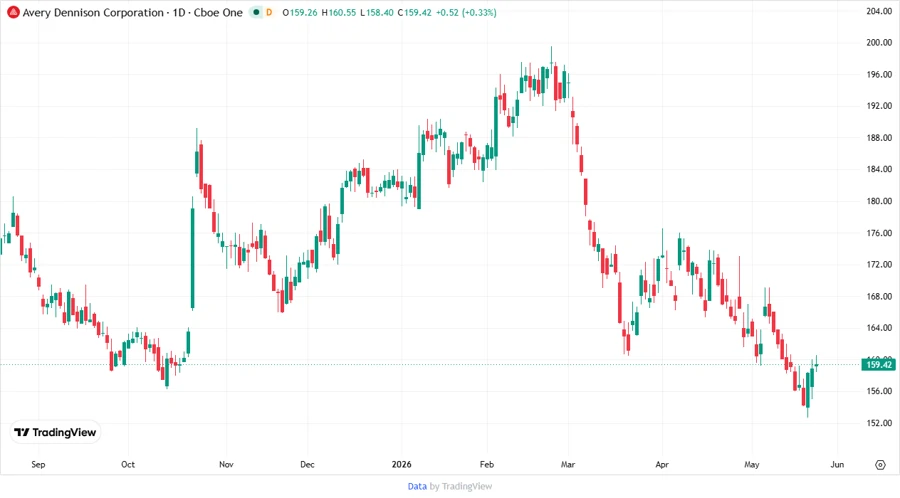
Avery Dennison Corporation is a leading player in the Consumer Cyclical sector, specializing in packaging and containers. Its financial performance, driven by a robust market presence, continues to garner attention from investors. With a strong history of innovation, this stock is one to watch in the current economic landscape.
Fundamental Rating
Avery Dennison exhibits solid financial health with an overall 'B+' rating. The strong figures for Return on Equity and Return on Assets demonstrate its profitability, though improvement in Debt to Equity is desired for a more balanced financial profile.
| Category | Score | Visual |
|---|---|---|
| Discounted Cash Flow | 3 | |
| Return on Equity | 5 | |
| Return on Assets | 5 | |
| Debt to Equity | 1 | |
| Price to Earnings | 3 | |
| Price to Book | 1 |
Historical Rating
A comparison of historical ratings helps assess the trajectory of the company's financial metrics, illustrating stability in performance.
| Date | Overall | DCF | ROE | ROA | Debt/Equity | P/E | P/B |
|---|---|---|---|---|---|---|---|
| 2026-05-22 | 3 | 3 | 5 | 5 | 1 | 3 | 1 |
| Historical | 3 | 3 | 5 | 5 | 1 | 3 | 1 |
Analyst Price Targets
With a consensus rating of 'Buy' and an attractive median price target, analysts see potential in the upward trend of Avery Dennison's stock value.
| High | Low | Median | Consensus |
|---|---|---|---|
| $224 | $192 | $221.5 | $214.75 |
Analyst Sentiment
The sentiment among analysts remains positive, with more 'Buy' recommendations leading the majority.
| Recommendation | Count | Visual |
|---|---|---|
| Strong Buy | 0 | |
| Buy | 13 | |
| Hold | 5 | |
| Sell | 0 | |
| Strong Sell | 0 |
Conclusion
Avery Dennison Corporation stands as a promising investment option within the packaging industry, driven by its substantial market footprint and consistent financial performance. While its profitability indicators are commendable, the company should focus on enhancing its Debt to Equity ratio for fortified financial stability. With positive analyst sentiment and potential for price appreciation, it poses a compelling opportunity for investors. Nonetheless, keeping an eye on market volatility and performance metrics remains crucial for making informed investment decisions.
Smart Data Insight
Master the Perfect Entry & Exit for this Stock
Don't leave your profits to chance. Historically, this stock follows specific seasonal patterns that institutional traders use to maximize returns.
- ✅ Identify the "Golden Buying Window"
- ✅ Avoid high-risk correction cycles
- ✅ Backtested data from the last 20+ years