May 20, 2026 a 05:08 am
CADCHF: Fibonacci Analysis
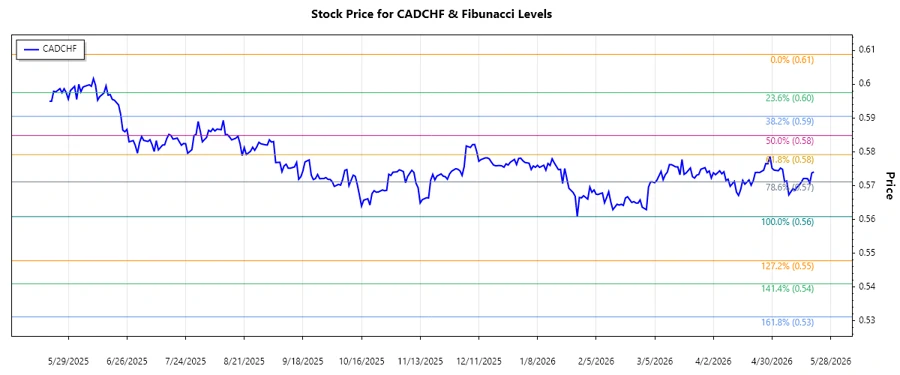
The CADCHF currency pair has been fluctuating with notable volatility in recent months, influenced by various economic factors. Recently, we've observed a dominant downside trend, with prices declining over a period of weeks. Understanding the key technical indicators and Fibonacci levels is crucial for anticipating potential support zones. Let's delve into the analysis of the recent price movements and identify critical areas based on Fibonacci retracement levels.
Fibonacci Analysis
Analysis of historical CADCHF data shows a significant downward trend. Utilizing this trend, Fibonacci retracement levels have been calculated. The data illustrates a price peak followed by a clear low, marking an ideal scenario to assess retracement levels.
| Trend Start Date | Trend End Date | High Price | High Date | Low Price | Low Date |
|---|---|---|---|---|---|
| 2026-03-01 | 2026-05-20 | 0.60885 | 2026-03-01 | 0.56085 | 2026-05-19 |
| Fibonacci Level | Price Level |
|---|---|
| 0.236 | 0.57272 |
| 0.382 | 0.57968 |
| 0.500 | 0.58485 |
| 0.618 | 0.59002 |
| 0.786 | 0.59640 |
The current price is approximately 0.57406, which positions it within the 0.236 Fibonacci retracement zone. The technical implication is that this level could act as a critical short-term resistance, suggesting cautious trading strategies around this price point.
A potential technical interpretation is that a further decline might find support around the recent low, while upward movements could face resistance around the 0.382 level.
Conclusion
The CADCHF currency pair presents both opportunities and risks given its current positioning within a Fibonacci retracement zone. The observed downtrend suggests caution for upward movements, with immediate resistance expected at the 0.236 level. Should the price fall below recent support levels, it could indicate further downside potential. On the other hand, a breakthrough of identified resistance levels might signal potential upward momentum. Analysts should remain vigilant, considering external economic factors and tracking price action closely to validate technical signals in this volatile market scenario.
Smart Data Insight
Master the Perfect Entry & Exit for this Stock
Don't leave your profits to chance. Historically, this stock follows specific seasonal patterns that institutional traders use to maximize returns.
- ✅ Identify the "Golden Buying Window"
- ✅ Avoid high-risk correction cycles
- ✅ Backtested data from the last 20+ years