
May 29, 2026 a 04:44 pm
EG: Fibonacci Analysis - Everest Re Group, Ltd.
The Everest Re Group, Ltd. has shown a resilient performance with fluctuations that are typical within its industry. The company’s strategy in diversifying its insurance and reinsurance operations across various geographies continues to provide a stable growth outlook despite market volatility. With recent adjustments in global insurance regulations, Everest Re is expected to benefit from its robust reinsurance portfolio. Market participants should remain watchful for any macroeconomic disruptions that might impact the insurance industry, although the company's diversified strategies present it with solid buffers against regional market instabilities.
Fibonacci Analysis
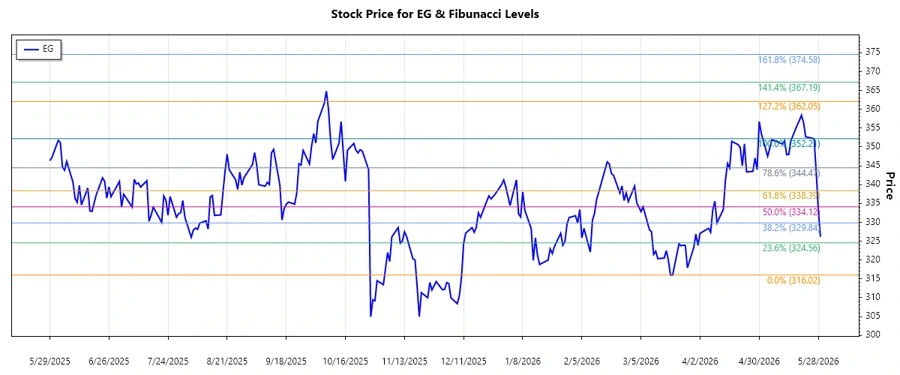
The Fibonacci Analysis over the most recent period highlights some key levels to watch for Everest Re Group, Ltd. Based on the historical data, there is a dominant upward trend identified from early 2026. The high point occurred on 2026-05-26 at $352.21, while the low point was noted on 2026-03-20 at $316.02. As of the current data point, the stock has recorded a price of $326.19. This data suggests potential retracement levels which investors can use to gauge future price movements.
| Date Range | High Date | High Price | Low Date | Low Price | Fibonacci Levels |
|---|---|---|---|---|---|
| 2026-03-20 to 2026-05-26 | 2026-05-26 | $352.21 | 2026-03-20 | $316.02 |
|
The current price of $326.19 is within the 0.786 retracement level. This suggests the potential for support around this price level. Technically, should the price hold at this level, it could serve as a solid base for future upward movements, otherwise, it could test lower support levels.
Conclusion
The recent upward trend in Everest Re Group stock suggests a positive momentum supported by strategic diversification and regulatory benefits. The identified Fibonacci levels provide key insights into potential support and resistance areas that are crucial for future price forecasting. Analysts should, however, remain vigilant about broader economic trends that may impact market conditions. The current retracement suggests the stock may find support at the 0.786 level, which could act as a pivot for either a continued bullish trend or a bearish correction if unmet by sufficient buy volume. Overall, while the growth prospects remain bullish, caution is advised given possible geopolitical and macroeconomic uncertainties.
Smart Data Insight
Master the Perfect Entry & Exit for this Stock
Don't leave your profits to chance. Historically, this stock follows specific seasonal patterns that institutional traders use to maximize returns.
- ✅ Identify the "Golden Buying Window"
- ✅ Avoid high-risk correction cycles
- ✅ Backtested data from the last 20+ years