
May 26, 2026 a 05:08 am
CADJPY: Fibonacci Analysis
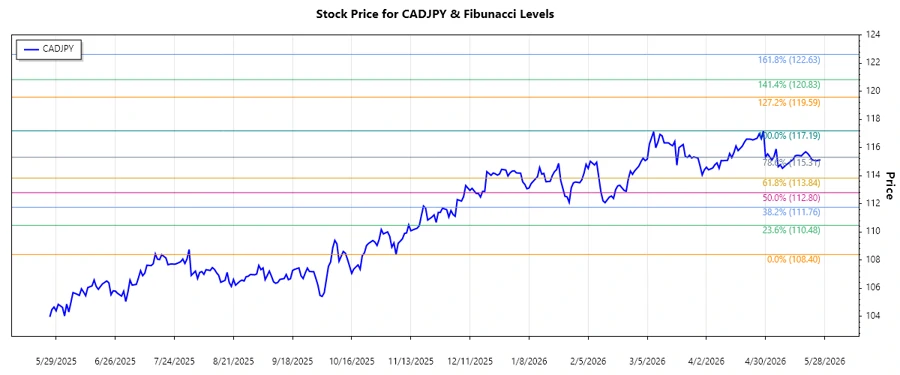
The CADJPY currency pair has demonstrated significant movements over the past months. With global economic factors influencing the currency exchange, the pair has shown a strong upward trend. This analysis focuses on utilizing Fibonacci retracement levels to assess potential support and resistance points. Understanding these dynamics aids traders in making informed decisions amidst currency market volatility.
Fibonacci Analysis
| Parameter | Value |
|---|---|
| Trend Start Date | 2025-11-05 |
| Trend End Date | 2026-05-26 |
| High Price (Date) | 117.194 (2026-04-29) |
| Low Price (Date) | 108.401 (2025-11-06) |
| Current Price | 115.131 |
| Fibonacci Levels |
|
| Retracement Zone | 0.236 (Current price is above this level) |
| Technical Interpretation | The CADJPY is currently in the 23.6% retracement zone, indicating potential resistance near this level. This suggests a bullish trend continuation if the price rebounds. |
Conclusion
The CADJPY currency pair presents promising opportunities as it remains in an overall upward trend. Traders should monitor the 23.6% Fibonacci retracement level closely, as it is a significant indicator of potential resistance. A break above this level could signal further bullish momentum, while a reversal may prompt caution. Analyzing technical parameters like Fibonacci retracement provides key insight into possible price movements, aiding decisions in a currency market characterized by rapid changes. Maintaining vigilance about geopolitical and economic developments can influence currency prices and affect trade outcomes.
Smart Data Insight
Master the Perfect Entry & Exit for this Stock
Don't leave your profits to chance. Historically, this stock follows specific seasonal patterns that institutional traders use to maximize returns.
- ✅ Identify the "Golden Buying Window"
- ✅ Avoid high-risk correction cycles
- ✅ Backtested data from the last 20+ years