May 24, 2026 a 04:28 am
NZDCAD: Trend and Support & Resistance Analysis
The NZDCAD currency pair has shown significant fluctuations in recent months. The current market conditions indicate a potential continuation of the observed trends. Traders need to be mindful of key support and resistance levels that could influence future movements. As market dynamics evolve, closely monitoring these zones will be critical in making informed trading decisions. The technical analysis provides insights into the potential direction of the currency pair.
Trend Analysis
| Date | Closing Price | Trend |
|---|---|---|
| 2026-05-22 | 0.80807 | ▼ |
| 2026-05-21 | 0.80863 | ▼ |
| 2026-05-20 | 0.80619 | ▼ |
| 2026-05-19 | 0.80160 | ▼ |
| 2026-05-18 | 0.80685 | ▼ |
| 2026-05-17 | 0.80288 | ▼ |
| 2026-05-15 | 0.80237 | ▼ |
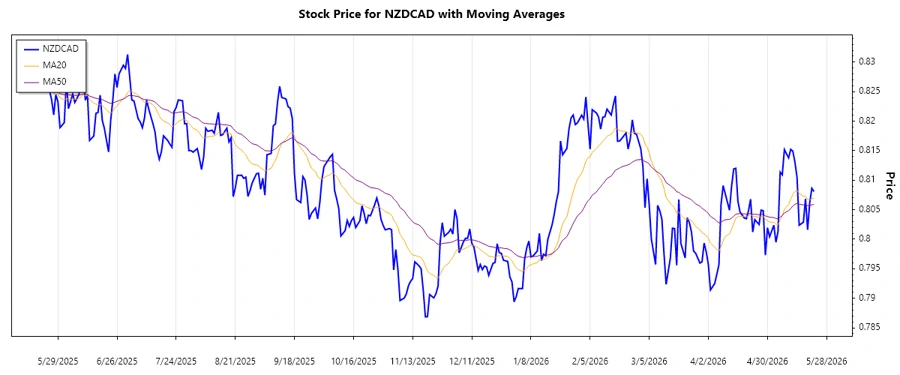
Analysis of the trend reveals continuous downward movement. The EMA20 is below the EMA50, confirming a sustained downtrend. In the short term, the currency pair shows limited upward momentum, suggesting potential opportunities in short selling strategies.
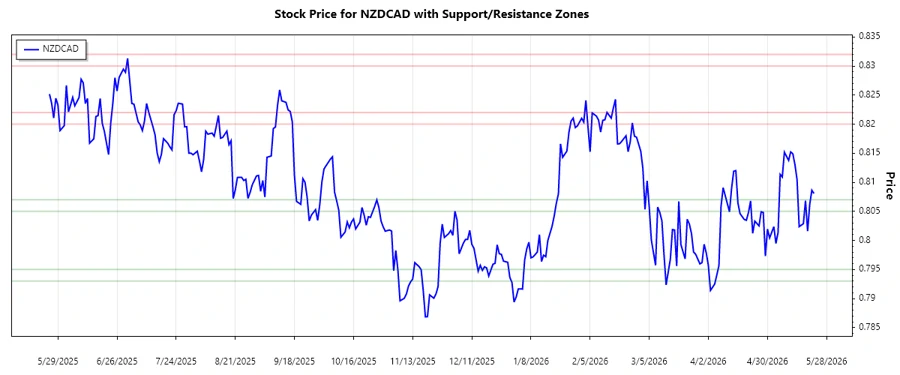
Support and Resistance
| Zone | From | To |
|---|---|---|
| Support 1 | 0.79300 | 0.79500 |
| Support 2 | 0.80500 | 0.80700 |
| Resistance 1 | 0.82000 | 0.82200 |
| Resistance 2 | 0.83000 | 0.83200 |
Currently, the closing price is hovering close to the lower support zone, indicating potential buying pressure. Traders should watch for a breakout from this zone to evaluate new trades.
Conclusion
The NZDCAD currency pair is currently in a downtrend with active traders focusing on short positions. Key support zones offer potential turning points; however, breaking these levels could signify further declines. Risk management is essential, considering possible reversals at resistance levels. The short-term outlook remains bearish unless decisive movements are observed at identified support levels. Monitoring market indicators will enhance trade precision in this volatile environment.
Smart Data Insight
Master the Perfect Entry & Exit for this Stock
Don't leave your profits to chance. Historically, this stock follows specific seasonal patterns that institutional traders use to maximize returns.
- ✅ Identify the "Golden Buying Window"
- ✅ Avoid high-risk correction cycles
- ✅ Backtested data from the last 20+ years