
May 29, 2026 a 03:43 pm
BXP: Fundamental Ratio Analysis - BXP, Inc.
Boston Properties (BXP) has shown resilience in the competitive office real estate market. As a leading developer and owner, their diverse portfolio promises long-term stability. However, potential investors should consider market volatility and economic factors affecting real estate.
Fundamental Rating
Boston Properties has a fundamental rating of B-, indicating moderate performance compared to peers. Here's a breakdown of key financial ratios:
| Category | Score | Visualization |
|---|---|---|
| Discounted Cash Flow | 4 | |
| Return on Equity | 3 | |
| Return on Assets | 3 | |
| Debt to Equity | 1 | |
| Price to Earnings | 1 | |
| Price to Book | 2 |
Historical Rating
Comparing historical data helps identify trends and performance consistency over time.
| Date | Overall | DCF | ROE | ROA | D/E | P/E | P/B |
|---|---|---|---|---|---|---|---|
| 2026-05-28 | 2 | 4 | 3 | 3 | 1 | 1 | 2 |
| Previous | 0 | 4 | 3 | 3 | 1 | 1 | 2 |
Analyst Price Targets
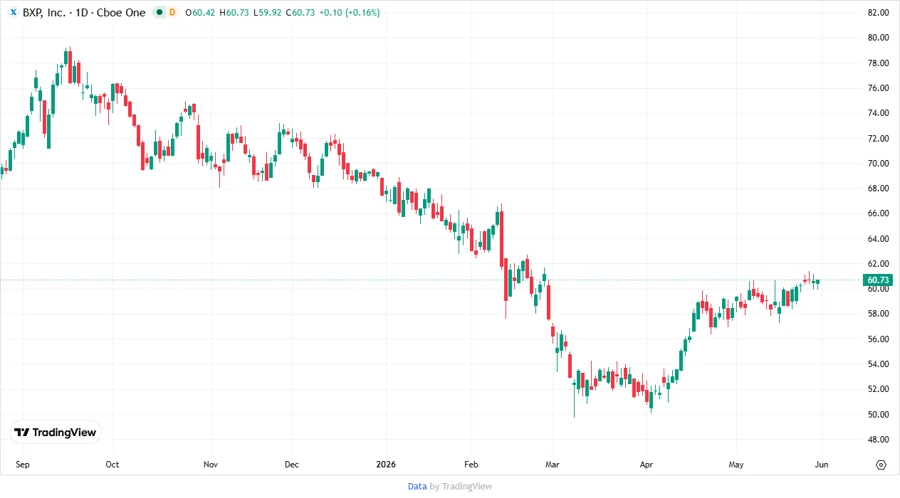
Analysts provide a bullish outlook with a consensus target of 66.33, highlighting potential growth.
| High | Low | Median | Consensus |
|---|---|---|---|
| 80 | 61 | 64 | 66.33 |
Analyst Sentiment
The majority of analysts recommend buying, albeit with caution as a minority suggests potential downsides.
| Recommendation | Count | Visualization |
|---|---|---|
| Strong Buy | 0 | |
| Buy | 23 | |
| Hold | 18 | |
| Sell | 1 | |
| Strong Sell | 0 |
Conclusion
Boston Properties (BXP) holds a strategic position in the real estate sector, backed by a robust portfolio. While its financials reflect moderate strengths, challenges persist in debt management and return ratios. Despite a supportive analyst consensus and promising price targets, investors should consider external market influences and potential volatility in the real estate landscape. The overall fundamentals suggest cautious optimism with room for improvement.
Smart Data Insight
Master the Perfect Entry & Exit for this Stock
Don't leave your profits to chance. Historically, this stock follows specific seasonal patterns that institutional traders use to maximize returns.
- ✅ Identify the "Golden Buying Window"
- ✅ Avoid high-risk correction cycles
- ✅ Backtested data from the last 20+ years