
May 29, 2026 a 08:00 am

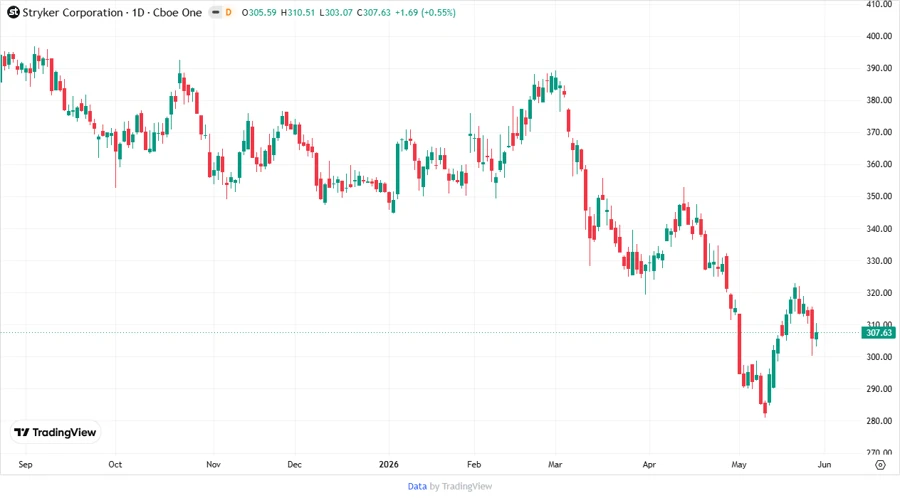
SYK: Fundamental Ratio Analysis - Stryker Corporation
Stryker Corporation operates as a leading medical technology company, housing a diverse range of products and innovations across MedSurg, Neurotechnology, Orthopaedics, and Spine. With a footprint in 75 countries, the company's diverse portfolio positions it well within the healthcare sector. However, market volatility and sector competition must be considered in any investment decision.
Fundamental Rating
The fundamental ratings of Stryker show a balanced performance across several key financial metrics despite some challenges.
| Category | Score | Visualization |
|---|---|---|
| Overall Score | 3 | |
| Discounted Cash Flow | 4 | |
| Return on Equity | 4 | |
| Return on Assets | 5 | |
| Debt to Equity | 1 | |
| Price to Earnings | 1 | |
| Price to Book | 1 |
Historical Rating
The comparison of historical data highlights the consistency in scores with slight fluctuations.
| Date | Overall | DCF | ROE | ROA | Debt/Equity | P/E | P/B |
|---|---|---|---|---|---|---|---|
| 2026-05-28 | 3 | 4 | 4 | 5 | 1 | 1 | 1 |
| Past Date | 0 | 4 | 4 | 5 | 1 | 1 | 1 |
Analysts Price Targets
Analysts provide optimistic price targets, suggesting growth potential for Stryker Corporation with a consensus leaning towards a buy.
| High | Low | Median | Consensus |
|---|---|---|---|
| $465.00 | $315.00 | $389.50 | $385.83 |
Analyst Sentiment
Analyst sentiment remains positive with a majority of buy ratings.
| Recommendation | Count | Visualization |
|---|---|---|
| Strong Buy | 1 | |
| Buy | 35 | |
| Hold | 14 | |
| Sell | 0 | |
| Strong Sell | 0 |
Conclusion
Stryker Corporation demonstrates robust performance in key financial areas, showcasing strength in its diversified operations. Analyst optimism reinforces this narrative with an overall buy recommendation, suggesting future growth. However, investors should remain cautious of external market pressures and evolving competition within the healthcare sector. Balancing risk and opportunity, Stryker remains a compelling investment for the strategically minded investor.
Smart Data Insight
Master the Perfect Entry & Exit for this Stock
Don't leave your profits to chance. Historically, this stock follows specific seasonal patterns that institutional traders use to maximize returns.
- ✅ Identify the "Golden Buying Window"
- ✅ Avoid high-risk correction cycles
- ✅ Backtested data from the last 20+ years