
May 29, 2026 a 03:31 pm
FAST: Dividend Analysis - Fastenal Company
Fastenal Company has a stable and reliable dividend history of 36 years, demonstrating a consistent commitment to returning value to shareholders through dividends. With a current dividend yield of 2.06% and a recent steady growth in dividends, Fastenal is a substantial choice for income-focused investors. The company’s management has successfully maintained a sustainable payout ratio, reinforcing its ability to continue its dividend practices.
📊 Overview
The company operates within the industrial distribution sector, which plays a crucial role in providing inventory management services and delivering products across industrial supply chains. Its current dividend yield stands at 2.06%, with a dividend per share of $0.875. Fastenal has a commendable history of 36 years of uninterrupted dividends without any recent cuts or suspensions.
| Metric | Value |
|---|---|
| Sector | Industrial Distribution |
| Dividend yield | 2.06 % |
| Current dividend per share | $0.875 |
| Dividend history | 36 years |
| Last cut or suspension | None |
📈 Dividend History
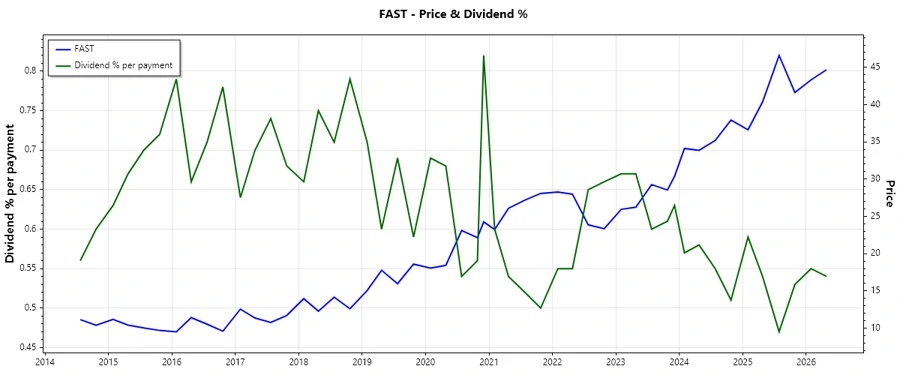
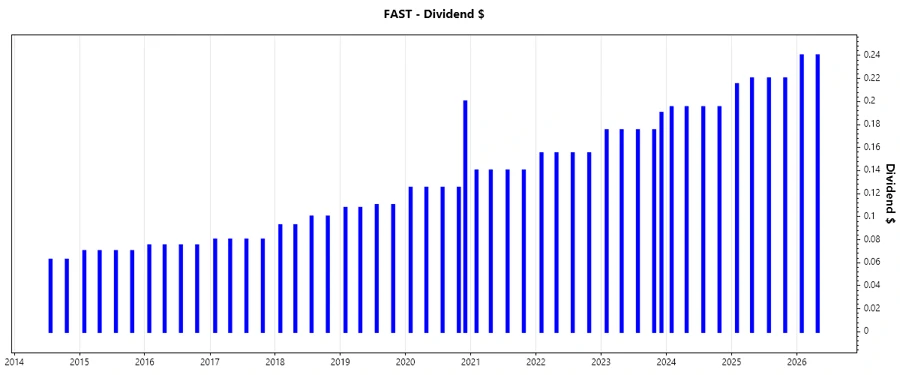
Understanding the dividend history provides insight into the company’s long-term commitment to shareholders and financial health. The stability suggests strong management practices and consistent cash flow generation. Reviewing past dividends helps predict future trends and reliability.
| Year | Dividend per Share |
|---|---|
| 2026 | $0.48 |
| 2025 | $0.875 |
| 2024 | $0.780 |
| 2023 | $0.890 |
| 2022 | $0.620 |
📉 Dividend Growth
Dividend growth is critical for investors seeking income that can keep pace with or even outstrip inflation. Over the last 3 and 5 years, Fastenal has shown a dividend growth of 12.17% and 4.56%, respectively. This growth indicates the company’s potential to enhance shareholder value over time.
| Time | Growth |
|---|---|
| 3 years | 12.17 % |
| 5 years | 4.56 % |
The average dividend growth is 4.56% over 5 years. This shows moderate but steady dividend growth.
⚠️ Payout Ratio
The payout ratio tells us how much of a company’s earnings are used to pay dividends to shareholders. Efficiency in retaining adequate earnings can assist in company expansion and maintain dividend payouts during lean financial periods. Fastenal’s payout ratios are comparatively high but reflect its stable financial structure.
| Type | Ratio |
|---|---|
| EPS-based | 77.30 % |
| Free cash flow-based | 86.34 % |
The EPS payout ratio stands at 77.30%, highlighting a considerable portion of earnings distributed to shareholders. The FCF payout ratio of 86.34% further reinforces the company's focus on rewarding shareholders while maintaining strategic reinvestment strategies.
💵 Cashflow & Capital Efficiency
Scrutinizing a company’s cash flow metrics reveals its operational robustness and capacity to sustain dividend payments. Fastenal demonstrates a consistent cash flow yield and effective capital allocation strategies.
| Metric | 2025 | 2024 | 2023 |
|---|---|---|---|
| Free Cash Flow Yield | 2.28 % | 2.30 % | 3.40 % |
| Earnings Yield | 2.73 % | 2.79 % | 3.12 % |
| CAPEX to Operating Cash Flow | 18.93 % | 19.30 % | 12.06 % |
| Stock-based Comp to Revenue | 0.10 % | 0.11 % | 0.10 % |
| Free Cash Flow / Operating Cash Flow Ratio | 81.07 % | 80.69 % | 87.94 % |
Fastenal’s strong cash generation and strategic capital allocation are apparent through its high operating cash flow coverage and robust free cash flow ratios, indicating effective financial stewardship.
💼 Balance Sheet & Leverage Analysis
Analyzing leverage ratios provides insight into the financial resilience of a company. Fastenal displays a robust balance sheet with low leverage, showcasing its commitment to maintaining financial flexibility.
| Metric | 2025 | 2024 | 2023 |
|---|---|---|---|
| Debt-to-Equity | 11.21 % | 13.42 % | 15.98 % |
| Debt-to-Assets | 8.75 % | 10.33 % | 11.99 % |
| Debt-to-Capital | 10.08 % | 11.83 % | 13.78 % |
| Net Debt to EBITDA | 0.10 | 0.14 | 0.18 |
| Current Ratio | 4.39 | 4.67 | 4.57 |
| Quick Ratio | 2.41 | 2.28 | 2.27 |
| Financial Leverage | 1.28 | 1.30 | 1.33 |
Fastenal's conservative leverage ratios affirm the strong financial health and risk management practices pivotal for sustaining operations and dividend commitments.
📊 Fundamental Strength & Profitability
Profitability metrics reveal the company’s efficiency and ability to generate profits relative to its revenue and capital base. Fastenal’s solid ROE and ROA coupled with strong margins across EBITDA and gross metrics highlight its operational efficiency and profitability strength.
| Metric | 2025 | 2024 | 2023 |
|---|---|---|---|
| Return on Equity | 31.91 % | 31.82 % | 34.49 % |
| Return on Assets | 24.90 % | 24.49 % | 25.88 % |
| Net Margin | 15.35 % | 15.25 % | 15.72 % |
| EBIT Margin | 20.19 % | 20.08 % | 20.81 % |
| EBITDA Margin | 20.19 % | 22.41 % | 23.22 % |
| Gross Margin | 45.01 % | 45.08 % | 45.66 % |
| R&D to Revenue | 0 % | 0 % | 0 % |
Fastenal’s profitability metrics underscore a sound operational foundation with commendable returns on assets and equity, supporting long-term business viability and consistent dividend capability.
📈 Price Development
✅ Dividend Scoring System
| Criteria | Score | Score Bar |
|---|---|---|
| Dividend yield | 4 | |
| Dividend Stability | 5 | |
| Dividend Growth | 3 | |
| Payout Ratio | 3 | |
| Financial Stability | 4 | |
| Dividend Continuity | 5 | |
| Cashflow Coverage | 4 | |
| Balance Sheet Quality | 4 |
Overall Score: 32/40
🗣️ Rating
Fastenal Company demonstrates a reliable dividend profile bolstered by its solid operational fundamentals, consistent cash flow efficiency, and disciplined financial leverage. With strong profitability and remarkable dividend history amidst a stable payout structure, Fastenal Company earns a favorable recommendation for investors seeking steady dividend income with moderate growth potential.
Smart Data Insight
Master the Perfect Entry & Exit for this Stock
Don't leave your profits to chance. Historically, this stock follows specific seasonal patterns that institutional traders use to maximize returns.
- ✅ Identify the "Golden Buying Window"
- ✅ Avoid high-risk correction cycles
- ✅ Backtested data from the last 20+ years