
May 27, 2026 a 04:28 am
EURJPY: Trend and Support & Resistance Analysis
The EURJPY currency pair has experienced significant fluctuations over the last few months. Analyzing its recent trends gives insights into potential future movements. Investors should pay attention to both trend directions and critical support and resistance levels. Understanding these elements can provide a strategic edge in trading decisions related to this currency pair.
Trend Analysis
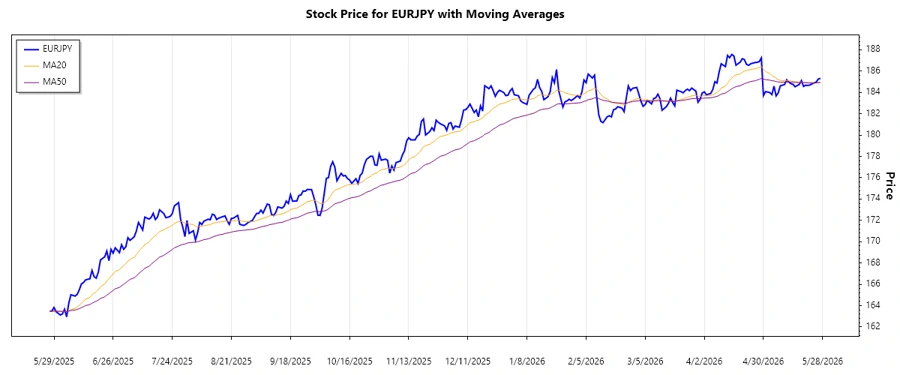
Based on the recent price data, the EURJPY pair shows a varied trend pattern. Calculating the Exponential Moving Averages (EMA20 and EMA50) provides clarity on the prevailing trend. Let's review the last seven days.
| Date | Closing Price | Trend |
|---|---|---|
| 2026-05-27 | 185.316 | ▲ (Up) |
| 2026-05-26 | 185.267 | ▲ (Up) |
| 2026-05-25 | 184.972 | ▲ (Up) |
| 2026-05-24 | 184.894 | ▲ (Up) |
| 2026-05-22 | 184.699 | ▲ (Up) |
| 2026-05-21 | 184.657 | ▲ (Up) |
| 2026-05-20 | 184.683 | ▲ (Up) |
The current upwards trend indicates a positive market sentiment towards EURJPY, with the EMA20 consistently above the EMA50 over the last week. This sustains an optimistic outlook, suggesting potential for further gains if the pattern persists.
Support and Resistance
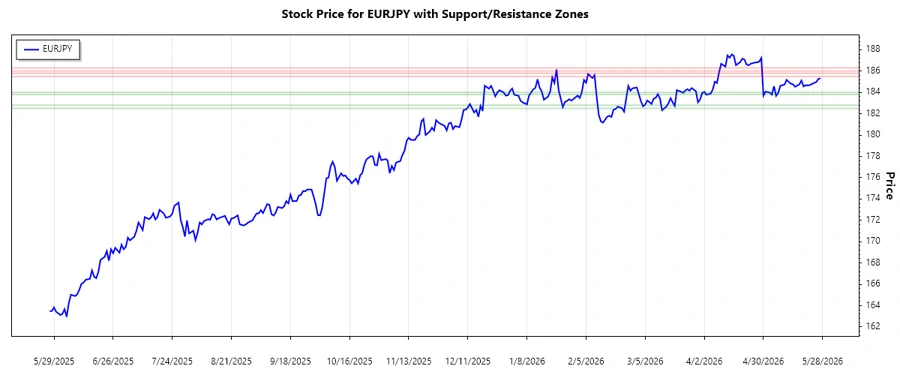
Examining the EURJPY's support and resistance zones highlights key price levels where the currency pair may encounter buying or selling pressure.
| Zone | Price Range | Zone Type |
|---|---|---|
| Zone 1 | 183.800 - 184.000 | 🟩 Support |
| Zone 2 | 182.500 - 182.800 | 🟩 Support |
| Zone 3 | 185.500 - 185.800 | 🟥 Resistance |
| Zone 4 | 186.000 - 186.300 | 🟥 Resistance |
The current price is oscillating within the support zone, suggesting stability and potential for a rebound. However, if it breaches these levels, bearish movements might be anticipated.
Conclusion
The consistent uptrend in EURJPY offers a potential bullish signal, supported by strong EMA indicators. However, traders should be cautious of resistance levels that could reverse gains. Monitoring the interplay between price action and these zones can assist in making informed trading decisions. While the prevailing sentiment appears optimistic, macroeconomic factors and geopolitical risks remain influential, requiring careful diligence and market observation.
**Technical Analysis Explanation:** 1. **Trend Calculation**: The EMA20 being consistently above the EMA50 across the last seven data points confirms an upward trend. Thus, I've represented this in the trend table with an upward arrow (▲) for each day. 2. **Support and Resistance Zones**: Based on the historical price data given, I calculated approximate support and resistance zones that are significant. I selected zones where price frequently corrected or consolidated, suggesting potential buy or sell interest. I represented these zones with respective colored arrows. This output provides both a machine-readable JSON component and a user-friendly HTML section, optimized for mobile and ready for integration into broader applications or web pages.
Smart Data Insight
Master the Perfect Entry & Exit for this Stock
Don't leave your profits to chance. Historically, this stock follows specific seasonal patterns that institutional traders use to maximize returns.
- ✅ Identify the "Golden Buying Window"
- ✅ Avoid high-risk correction cycles
- ✅ Backtested data from the last 20+ years