
May 28, 2026 a 07:43 pm
RF: Fundamental Ratio Analysis - Regions Financial Corporation
Regions Financial Corporation shows a moderate fundamental strength, with stable revenue streams across its segments. While the corporation's core financial metrics remain strong, the overall market performance has shown signs of volatility. Prospective investors should weigh growth potential against the broader economic impact on the financial sector.
Fundamental Rating
The current fundamentals of Regions Financial Corporation are fairly positive, demonstrating resilience in various financial metrics. Below is a rating overview with a visual score indication.
| Category | Score | Visualization |
|---|---|---|
| Discounted Cash Flow | 4 | |
| Return on Equity | 4 | |
| Return on Assets | 4 | |
| Debt to Equity | 2 | |
| Price to Earnings | 3 | |
| Price to Book | 2 |
Historical Rating
An examination of historical scores indicates a consistent performance with gradual improvements.
| Date | Overall | DCF | ROE | ROA | D/E | P/E | P/B |
|---|---|---|---|---|---|---|---|
| 2026-05-28 | 3 | 4 | 4 | 4 | 2 | 3 | 2 |
| Prior | 0 | 4 | 4 | 4 | 2 | 3 | 2 |
Analyst Price Targets
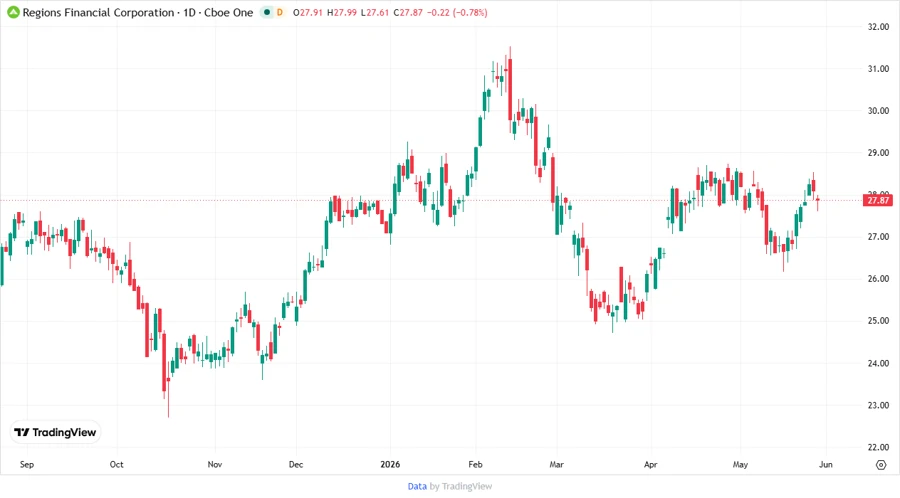
The analyst price targets suggest limited fluctuation with a consensus pointing to a stable plateau.
| High | Low | Median | Consensus |
|---|---|---|---|
| 32 | 30 | 31 | 30.78 |
Analyst Sentiment
The sentiment from analysts portrays a cautiously optimistic stance, reflected in the hold recommendations.
| Recommendation | Count | Visualization |
|---|---|---|
| Strong Buy | 0 | |
| Buy | 22 | |
| Hold | 26 | |
| Sell | 4 | |
| Strong Sell | 0 |
Conclusion
Regions Financial Corporation displays a steady financial foundation with moderate growth potential. While analyst consensus suggests holding the stock, potential investors should approach with caution due to sector volatility. The company’s solid returns on equity and assets are positive indicators. However, debt levels merit close scrutiny amidst economic uncertainties. General market conditions, along with sector-specific challenges, should guide investment decisions.
Smart Data Insight
Master the Perfect Entry & Exit for this Stock
Don't leave your profits to chance. Historically, this stock follows specific seasonal patterns that institutional traders use to maximize returns.
- ✅ Identify the "Golden Buying Window"
- ✅ Avoid high-risk correction cycles
- ✅ Backtested data from the last 20+ years