
May 29, 2026 a 05:15 am
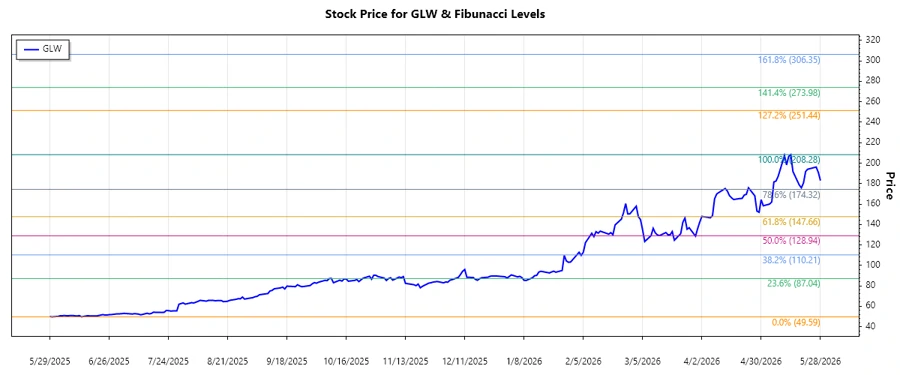
GLW: Fibonacci Analysis - Corning Incorporated
The stock of Corning Incorporated (GLW) has shown significant volatility over the analyzed period. With its diverse portfolio in display technologies and specialty materials, Corning remains a key player in its industry. However, investors should be aware of market fluctuations that could affect its stock performance. As the company continues to innovate, staying informed about technical indicators is crucial for making informed decisions.
Fibonacci Analysis
| Data | Value |
|---|---|
| Trend Start Date | 2025-06-09 |
| Trend End Date | 2026-05-14 |
| High Price | $208.28 on 2026-05-14 |
| Low Price | $49.59 on 2025-05-30 |
Fibonacci Levels
| Level | Price Level |
|---|---|
| 0.236 | $137.72 |
| 0.382 | $155.15 |
| 0.5 | $170.94 |
| 0.618 | $186.73 |
| 0.786 | $205.25 |
The current price is slightly above the 0.236 level at $182.94, indicating the stock is in a retracement phase beyond 0.5 but below 0.618. This suggests potential resistance around higher levels and a lookout for a reversal.
Conclusion
Corning's stock has experienced a strong upward trend, highlighted by its reach to historic highs within the given time frame. The company's innovative strides continue to drive strength in its market offerings. However, the challenge lies in sustaining these highs amid global market uncertainties. The analysis predicts resistance at higher retracement levels, signaling caution for near-term bullish trends. Technical analysts should monitor these levels closely for signs of reversal or breakout potential, weighing the company's strategic investments and market conditions.
Smart Data Insight
Master the Perfect Entry & Exit for this Stock
Don't leave your profits to chance. Historically, this stock follows specific seasonal patterns that institutional traders use to maximize returns.
- ✅ Identify the "Golden Buying Window"
- ✅ Avoid high-risk correction cycles
- ✅ Backtested data from the last 20+ years