
May 29, 2026 a 12:46 pm


EQIX: Dividend Analysis - Equinix, Inc.
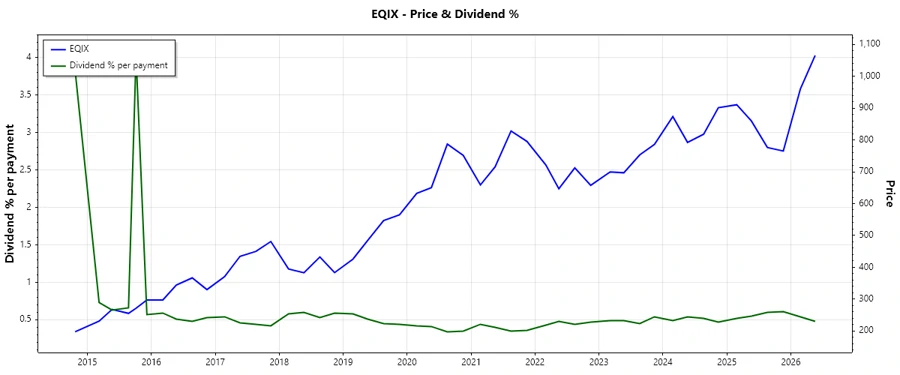
Equinix, Inc. presents a compelling dividend profile with a steady yield and a consistent history of dividend payments. While the dividend growth exhibits moderate expansion, the high payout ratios raise caution regarding sustainability. The company's balance sheet and cash flow indicators are crucial in assessing dividend reliability.
📊 Overview
The following table outlines key dividend-related figures for Equinix, Inc., providing insight into its sector and dividend metrics.
| Metric | Value |
|---|---|
| Sector | Real Estate |
| Dividend yield | 1.85 % |
| Current dividend per share | 18.96 USD |
| Dividend history | 13 years |
| Last cut or suspension | None |
📈 Dividend History
Examining the dividend history of Equinix, Inc. helps understand the company's commitment to returning value to shareholders. A long history of payouts reflects reliability and stability, incentivizing shareholder trust.
| Year | Dividend per Share (USD) |
|---|---|
| 2026 | 10.32 |
| 2025 | 18.76 |
| 2024 | 17.04 |
| 2023 | 14.49 |
| 2022 | 12.4 |
📊 Dividend Growth
Dividend growth is a key indicator of a company's ability to increase shareholder returns over time. It reflects financial health and management's confidence in future cash flows.
| Time | Growth |
|---|---|
| 3 years | 14.80 % |
| 5 years | 12.01 % |
The average dividend growth is 12.01 % over 5 years. This shows moderate but steady dividend growth.
📉 Payout Ratio
The payout ratio highlights how much of the earnings or cash flow are distributed as dividends, offering insight into dividend sustainability and potential future growth.
| Key Figure | Ratio |
|---|---|
| EPS-based | 131.20 % |
| Free cash flow-based | 210.59 % |
The EPS-based payout ratio of 131.20 % and a free cash flow payout ratio of 210.59 % suggest that Equinix, Inc. may be relying heavily on non-operational funds to sustain its dividend payouts, reflecting potential risks in maintaining current dividend levels.
✅ Cashflow & Capital Efficiency
This analysis emphasizes the cash flow stability and the company's capital efficiency, providing a deeper understanding of its financial dynamics and efficiency over the fiscal period.
| Metric | 2023 | 2024 | 2025 |
|---|---|---|---|
| Free Cash Flow Yield | 0.58 % | 0.20 % | -0.53 % |
| Earnings Yield | 1.29 % | 0.91 % | 1.80 % |
| CAPEX to Operating Cash Flow | 86.46 % | 94.37 % | 110.23 % |
| Stock-based Compensation to Revenue | 4.97 % | 5.28 % | 5.38 % |
| Free Cash Flow / Operating Cash Flow Ratio | 13.54 % | 5.63 % | -10.23 % |
The fluctuating free cash flow yield and high CAPEX to operating cash flow ratios indicate potential cash flow constraints, impacting the company’s ability to sustain dividend payouts solely from operating cash flows.
⚖️ Balance Sheet & Leverage Analysis
A thorough examination of the balance sheet and leverage ratios reveals the firm's financial stability and risk exposure related to its debt obligations.
| Metric | 2023 | 2024 | 2025 |
|---|---|---|---|
| Debt-to-Equity | 1.398 | 1.402 | 1.605 |
| Debt-to-Assets | 0.535 | 0.540 | 0.566 |
| Debt-to-Capital | 0.583 | 0.584 | 0.616 |
| Net Debt to EBITDA | 4.556 | 4.615 | 5.157 |
| Current Ratio | 1.128 | 1.626 | 1.316 |
| Quick Ratio | 1.128 | 1.626 | 1.316 |
| Financial Leverage | 2.614 | 2.594 | 2.836 |
The leverage ratios suggest that Equinix, Inc. maintains a moderate to high level of financial leverage, potentially posing challenges in coverage and liquidity should market conditions shift unfavorably.
🏆 Fundamental Strength & Profitability
Understanding the profitability ratios and margins is essential to evaluate the operational efficiency and earnings potential in the market context.
| Metric | 2023 | 2024 | 2025 |
|---|---|---|---|
| Return on Equity | 7.76 % | 6.02 % | 9.54 % |
| Return on Assets | 2.97 % | 2.32 % | 3.36 % |
| Margins: Net | 11.84 % | 9.32 % | 14.58 % |
| Margins: EBIT | 18.64 % | 16.37 % | 21.66 % |
| Margins: EBITDA | 41.17 % | 39.33 % | 43.97 % |
| Margins: Gross | 48.36 % | 48.94 % | 51.31 % |
| R&D to Revenue | 0.00 % | 0.00 % | 0.00 % |
The incremental profitability margins underscore Equinix, Inc.'s ability to control costs and generate profits in a competitive industry.
Price Development
Scoring System
An evaluative framework for assessing the dividend profile of Equinix, Inc., providing a holistic insight into its dividend strength.
| Category | Score | Score Representation |
|---|---|---|
| Dividend yield | 3 | |
| Dividend Stability | 4 | |
| Dividend growth | 3 | |
| Payout ratio | 2 | |
| Financial stability | 3 | |
| Dividend continuity | 4 | |
| Cashflow Coverage | 2 | |
| Balance Sheet Quality | 3 |
Total Score: 24/40
📢 Rating
Based on the exhaustive analysis, Equinix, Inc. offers a reliable yet cautiously optimistic dividend outlook. While the company's past dividend growth advocates for its potential, the substantial payout ratios require scrutiny. Stakeholders should monitor cash flow metrics and ensuing balance sheet negotiations as pivotal determinants of future performance.
Smart Data Insight
Master the Perfect Entry & Exit for this Stock
Don't leave your profits to chance. Historically, this stock follows specific seasonal patterns that institutional traders use to maximize returns.
- ✅ Identify the "Golden Buying Window"
- ✅ Avoid high-risk correction cycles
- ✅ Backtested data from the last 20+ years