
May 29, 2026 a 06:44 am
STZ: Fibonacci Analysis - Constellation Brands, Inc.
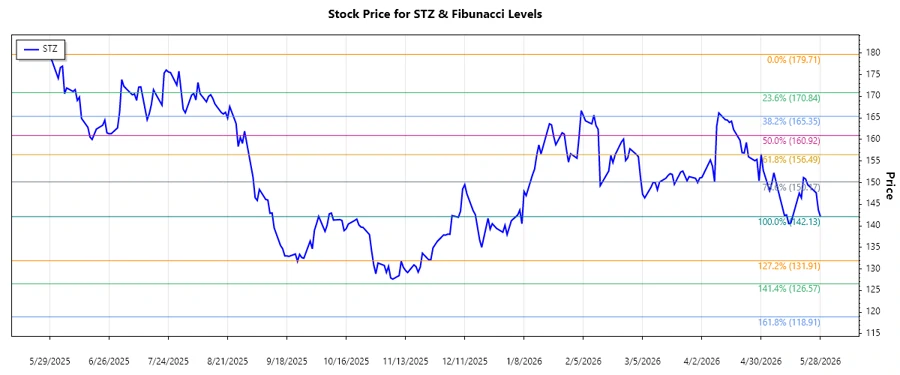
Constellation Brands, Inc. (STZ) has experienced a notable downtrend over the last several months. With its broad portfolio in beer, wine, and spirits, the company faces competitive pressures. The recent price movements suggest vulnerability but also potential opportunities if support levels hold firm. As the company navigates market challenges, investors have a watchful eye on its strategic initiatives to regain momentum.
Fibonacci Analysis
| Aspect | Details | ||||||||||||
|---|---|---|---|---|---|---|---|---|---|---|---|---|---|
| Trend Period: | August 29, 2025 - May 28, 2026 | ||||||||||||
| High Price & Date: | $179.71 on May 29, 2025 | ||||||||||||
| Low Price & Date: | $142.13 on May 28, 2026 | ||||||||||||
| Fibonacci Levels: |
|
||||||||||||
| Current Price Status: | The current price of $142.13 is below the 0.236 level, indicating it is not in a retracement zone. |
Conclusion
The analysis indicates a dominant downtrend in Constellation Brands, Inc. (STZ) stock over the past few months. The stock is trading below key Fibonacci retracement levels, which suggests potential downside momentum might still persist unless it finds strong support. The absence of a retracement into higher Fibonacci levels implies cautious positions for traders. Potential areas of resistance might form at these levels, offering vital entry/exit points. Analysts remain focused on the company's operational strategies to gauge future stock performance amid market dynamics.
Smart Data Insight
Master the Perfect Entry & Exit for this Stock
Don't leave your profits to chance. Historically, this stock follows specific seasonal patterns that institutional traders use to maximize returns.
- ✅ Identify the "Golden Buying Window"
- ✅ Avoid high-risk correction cycles
- ✅ Backtested data from the last 20+ years