
May 28, 2026 a 05:08 am
AUDUSD: Fibonacci Analysis
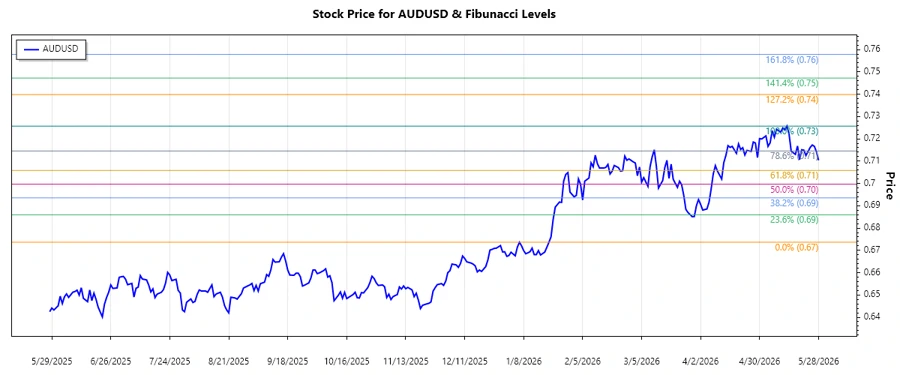
The AUDUSD recently exhibited a strong upward trend following a series of lower lows. The pair's performance has been a mix of recovery and consolidation, hinting at possible market corrections. As Australia and the US provide differing economic data, volatility could be expected, making it essential to monitor Fibonacci levels for potential retracement zones.
Fibonacci Analysis
The AUDUSD pair recently concluded a notable upward trend. Analyzed from March 20, 2026, to May 28, 2026, it showcases distinct movement, with the trend reaching a high of 0.72568 on May 13, 2026, and bottoming out at 0.67365 on January 20, 2026. Here we provide a detailed assessment of Fibonacci retracement levels and current market interpretations.
| Parameter | Details |
|---|---|
| Start Date | 2026-03-20 |
| End Date | 2026-05-28 |
| High Date | 2026-05-13 |
| High Price | 0.72568 |
| Low Date | 2026-01-20 |
| Low Price | 0.67365 |
| Fibonacci Level | Price Level |
|---|---|
| 0.236 | 0.68793 |
| 0.382 | 0.69493 |
| 0.5 | 0.69967 |
| 0.618 | 0.70441 |
| 0.786 | 0.71189 |
The current price of 0.71038 places the AUDUSD in the 0.786 Fibonacci retracement zone. This suggests a robust support level, but caution is warranted as price movements near these levels could indicate potential resistance or reversal.
Interpretation: The presence within the 0.786 retracement zone implies a significant support level that might act as a barrier to further decline. Traders might look for strategic entries, given the potential for price rebound or consolidation.
Conclusion
The AUDUSD has shown a notable recovery, gaining strength and reaching critical Fibonacci levels. As the currency trades near the 0.786 retracement level, analysts observe potential for rally continuation or a pullback due to prevailing market resistances. Australia’s economic indicators and US monetary policies will be pivotal in further trajectory. With continued fluctuations, traders need to exercise strategic caution and watch for confirmations before making trading decisions.
Smart Data Insight
Master the Perfect Entry & Exit for this Stock
Don't leave your profits to chance. Historically, this stock follows specific seasonal patterns that institutional traders use to maximize returns.
- ✅ Identify the "Golden Buying Window"
- ✅ Avoid high-risk correction cycles
- ✅ Backtested data from the last 20+ years