
May 26, 2026 a 04:28 am
EURGBP: Trend and Support & Resistance Analysis
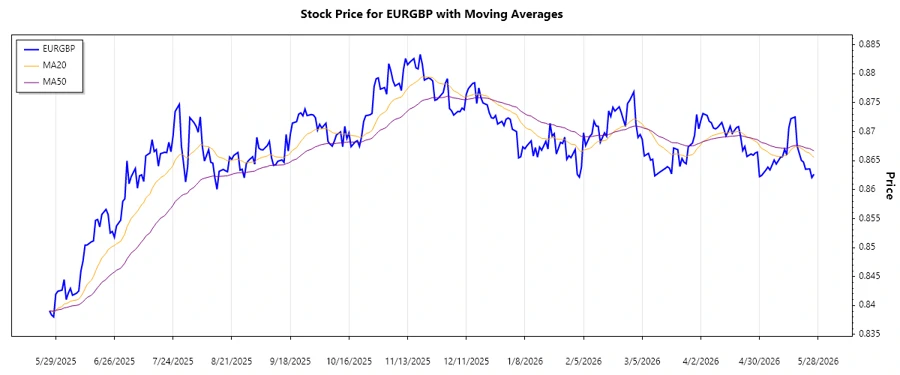
The EURGBP currency pair has shown interesting movements over the recent months, marked by fluctuations that leave room for both optimism and caution. Analyzing the moving averages, we can see a clear pattern that suggests prevailing market sentiments. Understanding the support and resistance levels further aids in anticipating potential price pivots. Staying updated with these technical indicators is crucial for making informed decisions in the trading world.
Trend Analysis
| Date | Closing Price | Trend |
|---|---|---|
| 2026-05-26 | 0.86266 | ⚖️ |
| 2026-05-25 | 0.86208 | ▼ |
| 2026-05-24 | 0.86358 | ⏶ |
| 2026-05-22 | 0.86352 | ⏶ |
| 2026-05-21 | 0.86476 | ⏶ |
| 2026-05-20 | 0.86505 | ⏶ |
| 2026-05-19 | 0.86625 | ⏶ |
The recent EMA readings suggest a neutral to mildly positive sentiment. However, the divergence between EMA20 and EMA50 has been minimal. The period has seen several reversals, indicating cautious market positions.
Support and Resistance Analysis
| Zone Type | From | To | Comment |
|---|---|---|---|
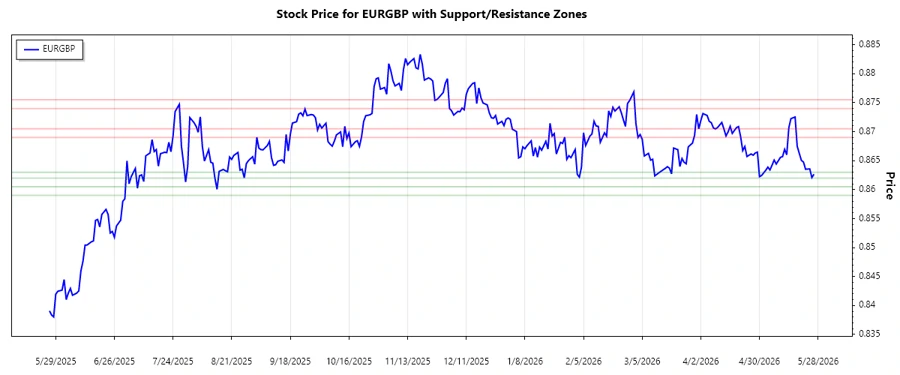
| Support | 0.86200 | 0.86300 | ⏬ Approaching |
| Support | 0.85900 | 0.86050 | ⏬ Below |
| Resistance | 0.86900 | 0.87050 | ⏫ Above |
| Resistance | 0.87400 | 0.87550 | ⏫ Above |
Currently, the price is only slightly above the first support zone and still well below the key resistance levels. If the price does not rebound, we may see a challenge to the lower support levels soon.
Conclusion
The EURGBP currency pair reflects a period of consolidation, with equal possibilities for a breakout in either direction. The key support and resistance levels mentioned should be closely monitored for a clearer path. Analysts should be ready to adjust their positions as new data becomes available. With slight volatility expected, there's an opportunity for traders to benefit from small price fluctuations, although caution should still be exercised given the broader economic backdrop.
Smart Data Insight
Master the Perfect Entry & Exit for this Stock
Don't leave your profits to chance. Historically, this stock follows specific seasonal patterns that institutional traders use to maximize returns.
- ✅ Identify the "Golden Buying Window"
- ✅ Avoid high-risk correction cycles
- ✅ Backtested data from the last 20+ years