
May 29, 2026 a 02:03 pm

EVRG: Trend and Support & Resistance Analysis - Evergy, Inc.
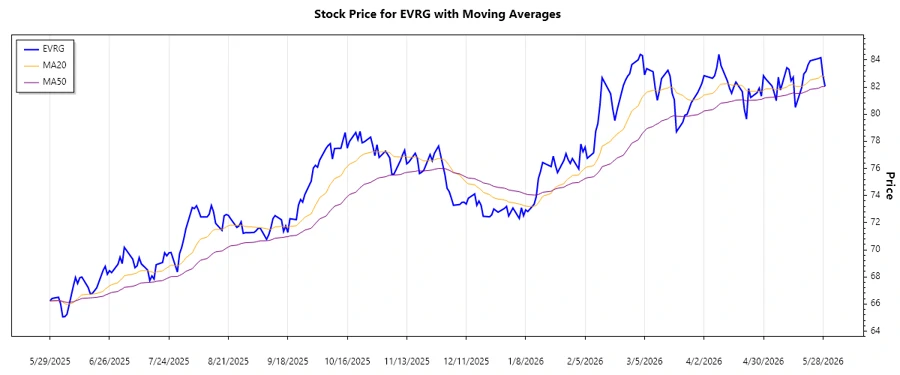
Evergy, Inc. has shown a significant performance over the past months. The company's diversified energy generation portfolio and robust transmission infrastructure position it well for stable revenue generation. However, recent price fluctuations indicate some investor uncertainty, potentially stemming from broader market conditions or sector-specific challenges. Conducting a thorough technical analysis can provide insight into future price movements.
Trend Analysis
Based on an examination of the historical price data, the recent trend of Evergy, Inc.'s stock can be discerned using the EMA20 and EMA50. Observing the latest data points, the EMA20 is slightly above the EMA50, signaling a ▲ upward trend, albeit not a very strong one, which indicates a modest bullish sentiment.
| Date | Close Price | Trend |
|---|---|---|
| 2026-05-29 | $82.06 | ▲ |
| 2026-05-28 | $82.85 | ▲ |
| 2026-05-27 | $84.17 | ▲ |
| 2026-05-26 | $84.11 | ▲ |
| 2026-05-22 | $83.94 | ▲ |
| 2026-05-21 | $83.65 | ▲ |
| 2026-05-20 | $83.16 | ▲ |
The recent data indicates a gentle upward trend. This suggests investors are gaining confidence in the stock, expecting it to maintain steady growth. The current technical analysis implies potential for strengthening as long as this trend persists.
Support- and Resistance
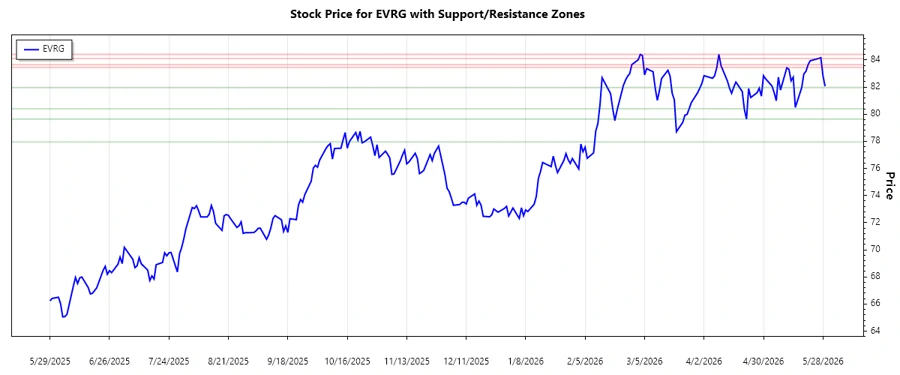
Analyzing the support and resistance levels provides insight into potential reversal or breakout points. For Evergy, Inc., the first support zone is calculated between $80.40 to $81.96, with a second support from $77.95 to $79.64. As for resistance, the stock encounters the first zone from $84.11 to $84.41 and a stronger zone from $83.44 to $83.65.
| Support Zone 1 | Support Zone 2 | Resistance Zone 1 | Resistance Zone 2 |
|---|---|---|---|
| $80.40-81.96 ▼ | $77.95-79.64 ▼ | $84.11-84.41 ▲ | $83.44-83.65 ▲ |
Currently, the stock price hovers near the first resistance zone, suggesting a potential challenge surpassing these price points unless new bullish signals emerge. Breaking past this resistance could indicate a stronger bullish phase ahead.
Conclusion
In conclusion, Evergy, Inc. shows a moderate upward movement, with recent price action suggesting optimism among investors. However, the presence of strong resistance zones implies caution, as these could hinder further ascent. Investors should monitor upcoming market developments and company announcements to gauge the sustainability of this trajectory. Balancing the identified upward trend with the critical resistance levels will be key to potential investment decisions.
Smart Data Insight
Master the Perfect Entry & Exit for this Stock
Don't leave your profits to chance. Historically, this stock follows specific seasonal patterns that institutional traders use to maximize returns.
- ✅ Identify the "Golden Buying Window"
- ✅ Avoid high-risk correction cycles
- ✅ Backtested data from the last 20+ years