
May 29, 2026 a 10:15 am
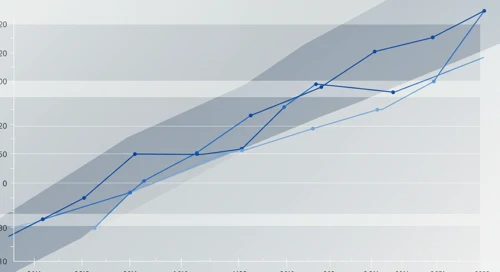

KKR: Fibonacci Analysis - KKR & Co. Inc.
KKR & Co. Inc. has shown resilience in a volatile market, largely influenced by its diverse investment portfolio. Recently, the stock has demonstrated a notable downward trend, presenting an opportunity to evaluate potential buying zones. Investors are keenly watching KKR's strategic moves in private equity and real estate sectors. The current technical analysis aims to determine key retracement levels that could indicate support or resistance.
Fibonacci Analysis
The recent data indicates a downward trend in KKR's stock price. The analysis below highlights key Fibonacci Retracement Levels that investors should monitor.
| Details | Information |
|---|---|
| Trend Start Date | 2025-12-11 |
| Trend End Date | 2026-05-28 |
| High Price (Date) | 142.77 (2025-12-11) |
| Low Price (Date) | 85.93 (2026-03-13) |
Fibonacci Levels:
| Level | Price |
|---|---|
| 0.236 | 99.38 |
| 0.382 | 107.45 |
| 0.5 | 114.35 |
| 0.618 | 121.25 |
| 0.786 | 131.20 |
Current Price Observation: As of the latest trading data, the KKR stock is currently at $94.03, sitting in the retracement zone of 0.236.
Interpretation: The presence of the price within this retracement range suggests potential short-term resistance around the $99 area, with possible support if prices retrace below current levels.
Conclusion
KKR & Co. Inc.'s recent downward momentum provides a technical landscape ripe for analysis. The identified Fibonacci retracement zones illustrate critical price levels that could act as future support or resistance. While the medium-term trend appears bearish, the valuation presents a potential for strategic entry points. Investors are advised to remain vigilant about market dynamics and KKR's ongoing strategic investments, which may modify its current trajectory. Patience and timing could be crucial factors for those considering entry into KKR as the investment firm continues navigating diverse market sectors.
Smart Data Insight
Master the Perfect Entry & Exit for this Stock
Don't leave your profits to chance. Historically, this stock follows specific seasonal patterns that institutional traders use to maximize returns.
- ✅ Identify the "Golden Buying Window"
- ✅ Avoid high-risk correction cycles
- ✅ Backtested data from the last 20+ years