
May 29, 2026 a 11:44 am

APP: Fibonacci Analysis - AppLovin Corporation
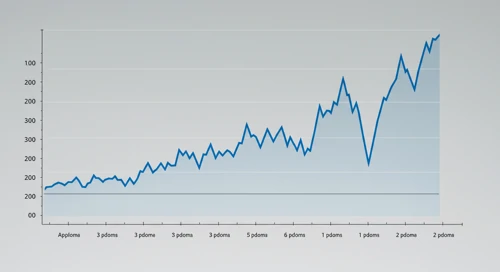
AppLovin Corporation has demonstrated strong performance over the recent period, with technical indicators suggesting a significant trend shift. This analysis highlights the key Fibonacci retracement levels, providing insight into potential price reversals and support levels. Traders should be attentive to these levels as they might represent crucial points of interest for future price movements.
Fibonacci Analysis
| Parameter | Details |
|---|---|
| Trend Type | Down |
| Start Date | 2025-12-22 |
| End Date | 2026-05-28 |
| High Point | 733.60 on 2025-12-22 |
| Low Point | 372.08 on 2026-03-30 |
| Fibonacci Levels |
|
| Current Price | 599.89 |
| In Retracement Zone | 0.618 |
| Technical Interpretation | The current price is within the 0.618 retracement zone, suggesting significant resistance. If the price breaks above this level, it may target higher resistance levels; otherwise, a pullback might test lower Fibonacci levels. |
Conclusion
The Fibonacci analysis of AppLovin Corporation indicates that the stock is undergoing a complex retracement phase. Positioned at a significant resistance level, the stock's movement will provide directional cues to traders. The identified levels hold potential as zones of support and resistance, guiding future price action. While opportunity exists for a continuation of the recovery above 0.618, careful monitoring for breakdown signals at this level is crucial for risk management.
Smart Data Insight
Master the Perfect Entry & Exit for this Stock
Don't leave your profits to chance. Historically, this stock follows specific seasonal patterns that institutional traders use to maximize returns.
- ✅ Identify the "Golden Buying Window"
- ✅ Avoid high-risk correction cycles
- ✅ Backtested data from the last 20+ years