
May 29, 2026 a 09:03 am

ES: Trend and Support & Resistance Analysis - Eversource Energy
Eversource Energy engages in essential utility operations, providing electricity, gas, and water services across several states in the US. Recent stock performance indicates potential volatility due to market dynamics that affect utility stocks. The company’s diverse involvement in energy and utility services makes it a significant player in the industry, offering both residential and corporate solutions. Evaluating its stock through technical analysis sheds light on prospective movements and investment opportunities.
Trend Analysis
| Date | Closing Price | Trend |
|---|---|---|
| 2026-05-28 | $69.09 | ▲ |
| 2026-05-27 | $69.62 | ▲ |
| 2026-05-26 | $69.70 | ▲ |
| 2026-05-22 | $70.00 | ▲ |
| 2026-05-21 | $69.63 | ▲ |
| 2026-05-20 | $69.05 | ▲ |
| 2026-05-19 | $68.81 | ▲ |
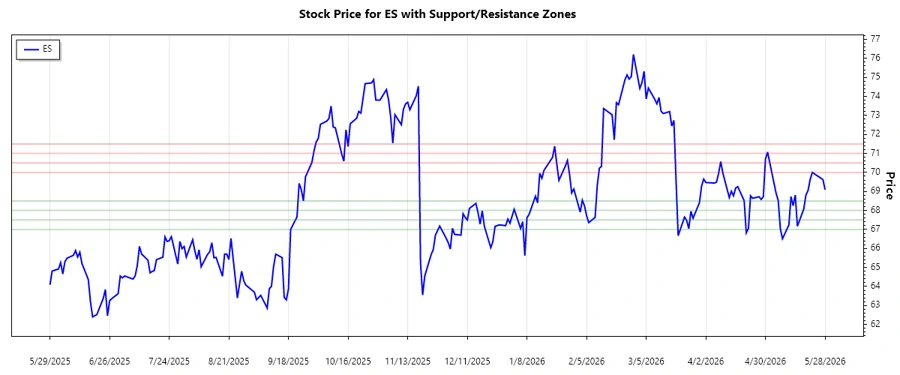
The technical analysis based on EMA suggests a current upward trend as the EMA20 exceeds EMA50. This trend may indicate market confidence in Eversource Energy’s operations and potential for moderate gains.
Support and Resistance
| Zone Type | Price Range |
|---|---|
| Support 1 | ▼ $68.00 - $68.50 |
| Support 2 | ▼ $67.00 - $67.50 |
| Resistance 1 | ▲ $70.00 - $70.50 |
| Resistance 2 | ▲ $71.00 - $71.50 |
The current stock price is nearing the resistance zone, potentially indicating a challenging barrier. While the stock shows signs of an upward trend, the resistance zones could lead to periods of consolidation or reversal.
Conclusion
The technical analysis of Eversource Energy (ES) projects a potential for continued asset growth, supported by a consistent upward trend. However, traders need to watch for resistance levels that could cause price rejections. Balancing opportunities with caution appears vital, particularly as the stock approaches areas of significant technical interest. These zones may serve as pivotal points for assessing investment entry and exit strategies, underlining the market sentiment towards utility services in a broad sense.
Smart Data Insight
Master the Perfect Entry & Exit for this Stock
Don't leave your profits to chance. Historically, this stock follows specific seasonal patterns that institutional traders use to maximize returns.
- ✅ Identify the "Golden Buying Window"
- ✅ Avoid high-risk correction cycles
- ✅ Backtested data from the last 20+ years