SOLV: Fundamental Ratio Analysis - Solventum Corporation

SOLV: Evaluation of key financial ratios, analyst ratings, and price targets. A data-driven perspective on the valuation and market expectations.
March 12, 2026 a 03:43 pm
BKR: Dividend Analysis - Baker Hughes Company

BKR: In-depth analysis of a company's dividend stability and key fundamental ratios to assess its financial strength and long-term investment potential.
March 12, 2026 a 03:31 pm
IRM: Fibunacci Level Technical Analysis - Iron Mountain Incorporated
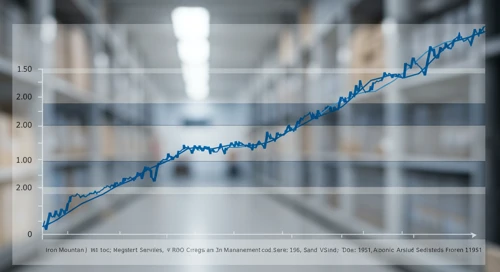
IRM: Fibonacci retracement levels to identify key potential support and resistance zones, based on recent price trends.
March 12, 2026 a 03:16 pm
Financials Comparison. 12 Mar

Comparison of Financials. Where is strength and weakness? What has developed well and badly?
March 12, 2026 a 03:12 pm
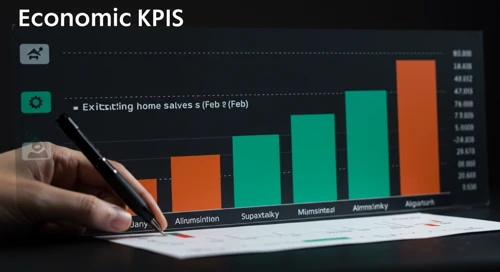
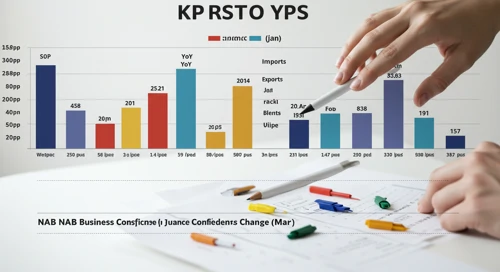
Todays Important Key Figures 12 Mar
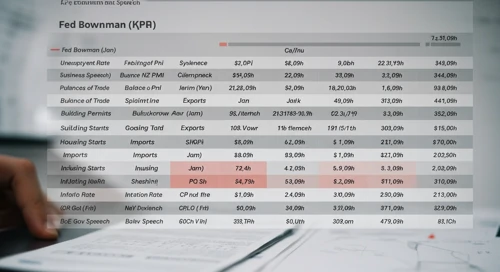
Today’s important economic data releases – a snapshot of key indicators influencing markets and shaping financial expectations.
March 12, 2026 a 03:00 pm
MSI: Trend with Support and Resistance Levels - Motorola Solutions Inc
MSI: Current price trend is evaluated alongside key support and resistance level. View of potential turning points and price momentum.
March 12, 2026 a 02:03 pm
KMB: Analysts Ratings - Kimberly Clark Corporation
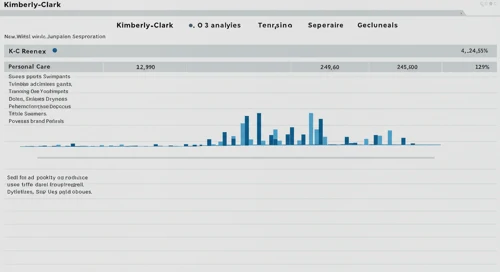
KMB: Comprehensive breakdown of current and historical analyst ratings, offering insights into how expert sentiment has evolved over time.
March 12, 2026 a 01:00 pm
ROL: Fundamental Ratio Analysis - Rollins Inc
March 12, 2026 a 06:00 pm
ROK: Analysts Ratings - Rockwell Automation Inc
March 12, 2026 a 05:00 pm
BEN: Fibunacci Level Technical Analysis - Franklin Resources Inc
March 12, 2026 a 04:44 pm
VRTX: Analysts Ratings - Vertex Pharmaceuticals Incorporated
March 12, 2026 a 04:38 pm
HBAN: Fundamental Ratio Analysis - Huntington Bancshares Incorporated
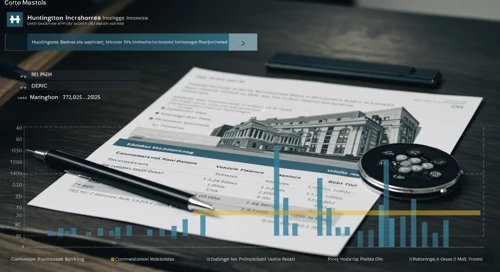
HBAN: Evaluation of key financial ratios, analyst ratings, and price targets. A data-driven perspective on the valuation and market expectations.
March 12, 2026 a 01:00 pm
SPGI: Dividend Analysis - SandP Global Inc

SPGI: In-depth analysis of a company's dividend stability and key fundamental ratios to assess its financial strength and long-term investment potential.
March 12, 2026 a 12:46 pm
IRM: Analysts Ratings - Iron Mountain Incorporated

IRM: Comprehensive breakdown of current and historical analyst ratings, offering insights into how expert sentiment has evolved over time.
March 12, 2026 a 12:38 pm
Bonds Comparison. 12 Mar

Comparison of Bonds. Where is strength and weakness? What has developed well and badly?
March 12, 2026 a 12:31 pm
CTRA: Fibunacci Level Technical Analysis - Coterra Energy Inc
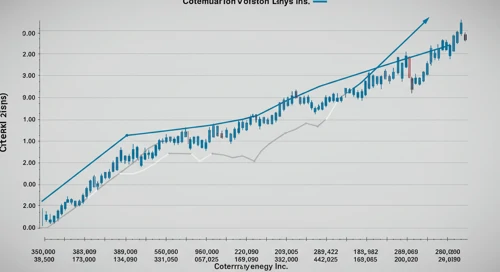
CTRA: Fibonacci retracement levels to identify key potential support and resistance zones, based on recent price trends.
March 12, 2026 a 11:44 am
CRH: Fundamental Ratio Analysis - CRH plc
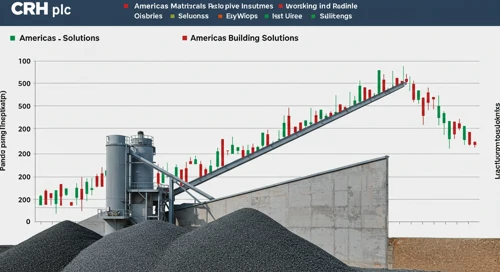
CRH: Evaluation of key financial ratios, analyst ratings, and price targets. A data-driven perspective on the valuation and market expectations.
March 12, 2026 a 11:43 am
IFF: Dividend Analysis - International Flavors and Fragrances Inc
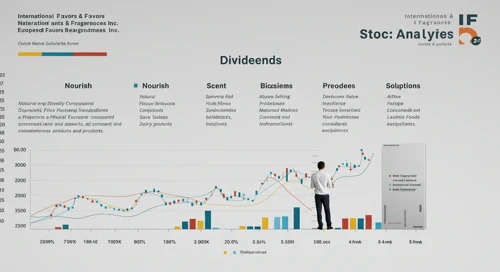
IFF: In-depth analysis of a company's dividend stability and key fundamental ratios to assess its financial strength and long-term investment potential.
March 12, 2026 a 11:31 am
Stock Market - Heatmap
Use mouse wheel to zoom in and out. Click a ticker to display detailed information in a new window. Hover mouse cursor over a ticker to see more data.
Stock's
ADSK: Fundamental Ratio Analysis - Autodesk Inc
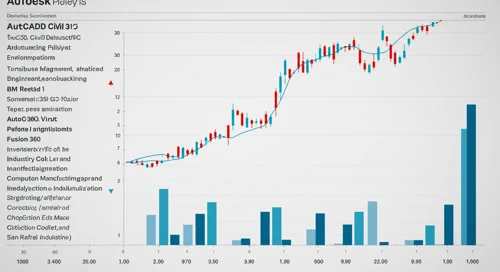
ADSK: Evaluation of key financial ratios, analyst ratings, and price targets. A data-driven perspective on the valuation and market expectations.
March 12, 2026 a 08:00 am
HPQ: Dividend Analysis - HP Inc

HPQ: In-depth analysis of a company's dividend stability and key fundamental ratios to assess its financial strength and long-term investment potential.
March 12, 2026 a 07:46 am
NXPI: Fundamental Ratio Analysis - NXP Semiconductors NV
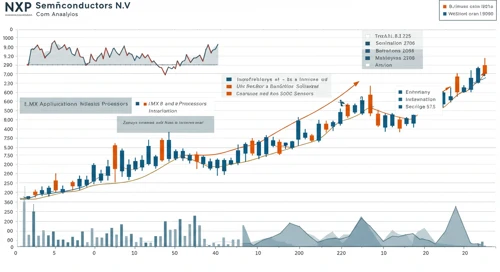
NXPI: Evaluation of key financial ratios, analyst ratings, and price targets. A data-driven perspective on the valuation and market expectations.
March 12, 2026 a 07:43 am
LIN: Dividend Analysis - Linde plc
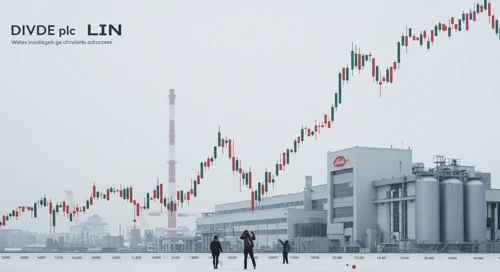
LIN: In-depth analysis of a company's dividend stability and key fundamental ratios to assess its financial strength and long-term investment potential.
March 12, 2026 a 07:31 am
LLY: Fibunacci Level Technical Analysis - Eli Lilly and Company
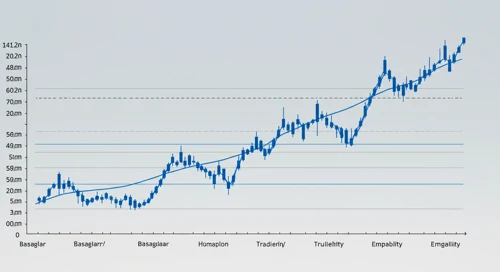
LLY: Fibonacci retracement levels to identify key potential support and resistance zones, based on recent price trends.
March 12, 2026 a 06:44 am
BRK B: Fibunacci Level Technical Analysis - Berkshire Hathaway Inc
BRK-B: Fibonacci retracement levels to identify key potential support and resistance zones, based on recent price trends.
March 12, 2026 a 05:15 am
URI: Trend with Support and Resistance Levels - United Rentals Inc
URI: Current price trend is evaluated alongside key support and resistance level. View of potential turning points and price momentum.
March 12, 2026 a 04:03 am
APA: Fibunacci Level Technical Analysis - APA Corporation
March 12, 2026 a 10:15 am
PNR: Trend with Support and Resistance Levels - Pentair plc
March 12, 2026 a 09:03 am

BF B: Analysts Ratings - Brown Forman Corporation
March 12, 2026 a 09:00 am
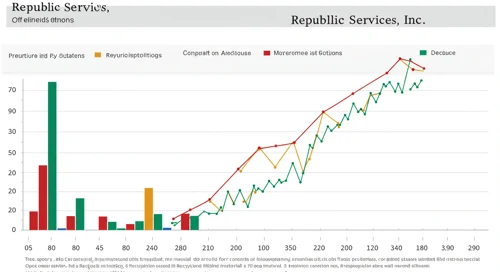
RSG: Analysts Ratings - Republic Services Inc
March 12, 2026 a 08:38 am
QCOM: Trend with Support and Resistance Levels - QUALCOMM Incorporated
QCOM: Current price trend is evaluated alongside key support and resistance level. View of potential turning points and price momentum.
March 12, 2026 a 03:15 am
APD: Analysts Ratings - Air Products and Chemicals Inc
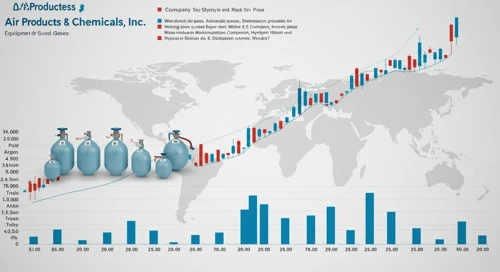
APD: Comprehensive breakdown of current and historical analyst ratings, offering insights into how expert sentiment has evolved over time.
March 11, 2026 a 09:00 pm
CPRT: Analysts Ratings - Copart Inc
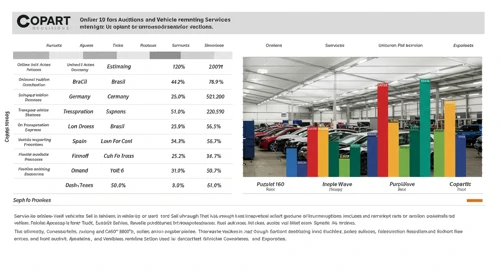
CPRT: Comprehensive breakdown of current and historical analyst ratings, offering insights into how expert sentiment has evolved over time.
March 11, 2026 a 08:38 pm
KKR: Fundamental Ratio Analysis - KKR and Co Inc

KKR: Evaluation of key financial ratios, analyst ratings, and price targets. A data-driven perspective on the valuation and market expectations.
March 11, 2026 a 07:43 pm
NSC: Fundamental Ratio Analysis - Norfolk Southern Corporation
NSC: Evaluation of key financial ratios, analyst ratings, and price targets. A data-driven perspective on the valuation and market expectations.
March 11, 2026 a 06:00 pm
EXE: Analysts Ratings - Expand Energy Corporation
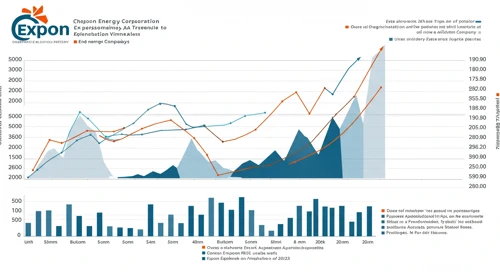
EXE: Comprehensive breakdown of current and historical analyst ratings, offering insights into how expert sentiment has evolved over time.
March 11, 2026 a 05:00 pm
NTRS: Fibunacci Level Technical Analysis - Northern Trust Corporation
NTRS: Fibonacci retracement levels to identify key potential support and resistance zones, based on recent price trends.
March 11, 2026 a 04:45 pm
Economic Calendar
Currencies
EURNZD: Fibunacci Level Technical Analysis
EURNZD: Fibonacci retracement levels to identify key potential support and resistance zones, based on recent price trends.
March 11, 2026 a 05:08 am
Todays Important Key Figures 10 Mar
Today’s important economic data releases – a snapshot of key indicators influencing markets and shaping financial expectations.
March 10, 2026 a 07:02 pm
CADJPY: Fibunacci Level Technical Analysis
CADJPY: Fibonacci retracement levels to identify key potential support and resistance zones, based on recent price trends.
March 10, 2026 a 05:08 am
EURCHF: Trend with Support and Resistance Levels
EURCHF: Current price trend is evaluated alongside key support and resistance level. View of potential turning points and price momentum.
March 10, 2026 a 04:28 am
Important Key Figures of the last Days
Overview of key economic indicators released over the past days, highlighting their potential impact on markets and investor sentiment.
March 10, 2026 a 02:31 am
Todays Important Key Figures 09 Mar
Today’s important economic data releases – a snapshot of key indicators influencing markets and shaping financial expectations.
March 09, 2026 a 07:00 pm
NZDJPY: Fibunacci Level Technical Analysis
NZDJPY: Fibonacci retracement levels to identify key potential support and resistance zones, based on recent price trends.
March 09, 2026 a 05:08 am
AUDNZD: Fibunacci Level Technical Analysis
March 12, 2026 a 05:08 am
CHFJPY: Trend with Support and Resistance Levels
March 12, 2026 a 04:28 am
Important Key Figures of the last Days
March 12, 2026 a 02:31 am

Todays Important Key Figures 11 Mar
March 11, 2026 a 07:00 pm
USDCHF: Trend with Support and Resistance Levels
USDCHF: Current price trend is evaluated alongside key support and resistance level. View of potential turning points and price momentum.
March 09, 2026 a 04:28 am
GBPCAD: Fibunacci Level Technical Analysis
GBPCAD: Fibonacci retracement levels to identify key potential support and resistance zones, based on recent price trends.
March 08, 2026 a 05:08 am
GBPAUD: Fibunacci Level Technical Analysis
GBPAUD: Fibonacci retracement levels to identify key potential support and resistance zones, based on recent price trends.
March 07, 2026 a 05:08 am
NZDCHF: Trend with Support and Resistance Levels
NZDCHF: Current price trend is evaluated alongside key support and resistance level. View of potential turning points and price momentum.
March 07, 2026 a 04:28 am
Todays Important Key Figures 07 Mar
Today’s important economic data releases – a snapshot of key indicators influencing markets and shaping financial expectations.
March 06, 2026 a 11:00 pm
Todays Important Key Figures 06 Mar

Today’s important economic data releases – a snapshot of key indicators influencing markets and shaping financial expectations.
March 06, 2026 a 07:00 pm
EURGBP: Fibunacci Level Technical Analysis
EURGBP: Fibonacci retracement levels to identify key potential support and resistance zones, based on recent price trends.
March 06, 2026 a 05:08 am
Currencies