March 12, 2026 a 02:03 pm

MSI: Trend and Support & Resistance Analysis - Motorola Solutions, Inc.
Motorola Solutions, Inc. has demonstrated a notable resilience in its market position through steady advancements in mission-critical communications. Technical analysis of recent price patterns indicates potential opportunities for investors. The latest trend signifies a consistent recovery in stock prices, supported by fundamental business strengths and strategic expansions.
Trend Analysis
| Date | Close Price | Trend |
|---|---|---|
| 2026-03-12 | 465.355 | ▲ |
| 2026-03-11 | 462.56 | ▲ |
| 2026-03-10 | 464.11 | ▲ |
| 2026-03-09 | 458.03 | ▼ |
| 2026-03-06 | 460.76 | ▲ |
| 2026-03-05 | 467.16 | ▲ |
| 2026-03-04 | 478.21 | ▲ |
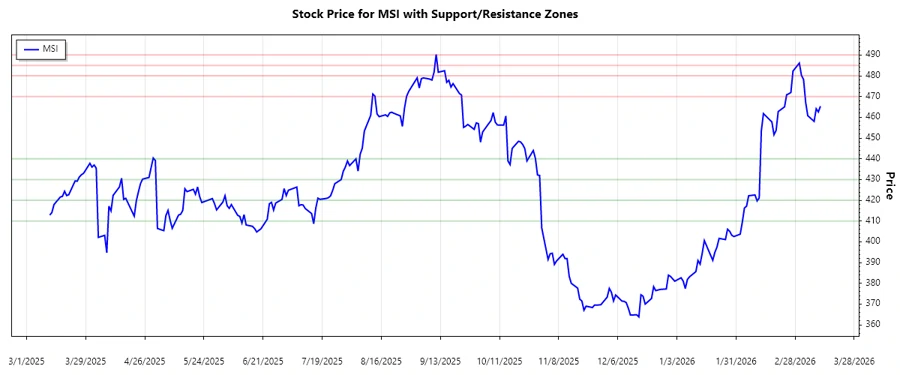
The short-term moving average (EMA20) is consistently above the long-term (EMA50), confirming a strong uptrend. Investors may consider the current market at an opportune point for entry.
Support- and Resistance
| Zone Type | From | To |
|---|---|---|
| Support Zone 1 | 410.00 | 420.00 |
| Support Zone 2 | 430.00 | 440.00 |
| Resistance Zone 1 | 470.00 | 480.00 |
| Resistance Zone 2 | 485.00 | 490.00 |
Currently, the stock price is approaching the upper levels of the resistance zone, suggesting possible near-term price ceilings that might require breakout before further upward movement.
Conclusion
Motorola Solutions, Inc. displays a robust upward trajectory, bolstered by strategic market positioning and continuous innovation in communication technologies. The stock is presently in proximity to a resistance zone, which may challenge further price appreciation unless breached. Investors should be vigilant for potential reversal signals should the price fail to break through this resistance. Overall, the stock's technical indicators present a cautiously optimistic stance for potential gains. Analysts should monitor these levels closely for confirmation of trend continuation or reversal.