March 12, 2026 a 03:31 pm
BKR: Dividend Analysis - Baker Hughes Company
Baker Hughes Company presents a compelling dividend profile characterized by consistent dividend distributions and a steady yield. The company has maintained its dividend history for over four decades, reflecting stability and commitment to returning value to shareholders. Despite challenges in the broader energy sector, Baker Hughes has adeptly managed its financial foothold, evidenced by prudent payout ratios and growing dividends over the last five years.
📊 Overview
| Sector | Dividend yield (%) | Current dividend per share (USD) | Dividend history (years) | Last cut or suspension |
|---|---|---|---|---|
| Energy Equipment & Services | 1.54 % | 0.92 USD | 40 years | None |
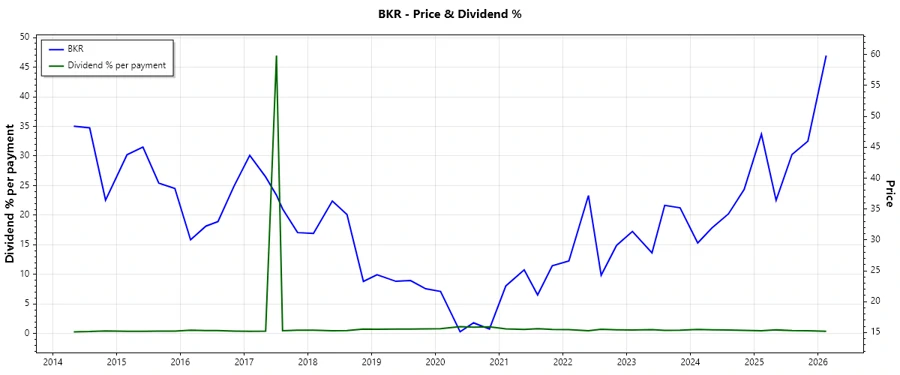
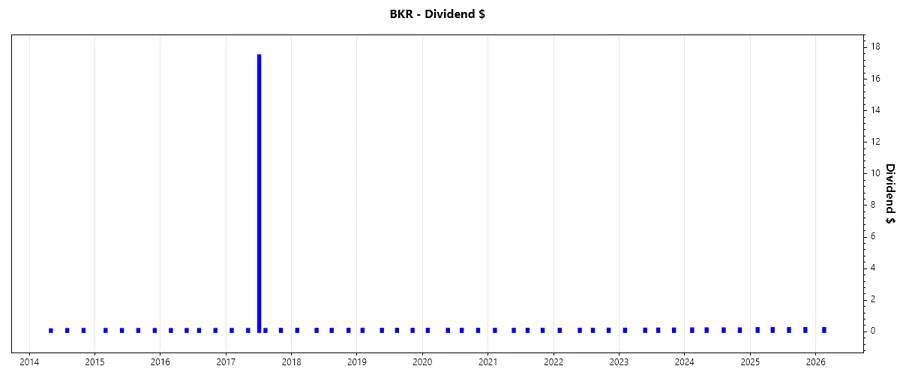
📈 Dividend History
The extensive history of dividend payments by Baker Hughes affirms the firm’s resilience and adaptability to market cycles. Continuous dividend payouts over the years highlight steady cash flow generation, critical for long-term investors.
| Year | Dividend per Share (USD) |
|---|---|
| 2026 | 0.23 |
| 2025 | 0.92 |
| 2024 | 0.84 |
| 2023 | 0.78 |
| 2022 | 0.73 |
📈 Dividend Growth
The growth trajectory of Baker Hughes's dividend demonstrates a moderate and consistent upward trend, vital for enhancing shareholder value over time.
| Time | Growth |
|---|---|
| 3 years | 8.02 % |
| 5 years | 5.02 % |
The average dividend growth is 5.02 % over 5 years. This shows moderate but steady dividend growth.
📉 Payout Ratio
The payout ratios for EPS (35.16 %) and FCF (35.86 %) indicate a healthy balance between rewarding shareholders and retaining earnings for reinvestment, ensuring sustainable dividend practices.
| Key figure | Ratio |
|---|---|
| EPS-based | 35.16 % |
| Free cash flow-based | 35.86 % |
The payout ratios underscore Baker Hughes's conservative approach, positioning it well to withstand economic fluctuations while maintaining shareholder payouts.
✅ Cashflow & Capital Efficiency
Cashflow and capital efficiency are vital to a company’s operational performance and its ability to sustain dividend distributions.
| Year | 2025 | 2024 | 2023 |
|---|---|---|---|
| Free Cash Flow Yield | 5.64 % | 5.01 % | 5.33 % |
| Earnings Yield | 5.75 % | 7.26 % | 5.64 % |
| CAPEX to Operating Cash Flow | 33.38 % | 38.35 % | 39.97 % |
| Stock-based Compensation to Revenue | 0.73 % | 0.73 % | 0.77 % |
| Free Cash Flow / Operating Cash Flow Ratio | 66.59 % | 61.64 % | 60.03 % |
The data suggests Baker Hughes operates with efficient cash flow management and prudent use of capital, enhancing its ability to drive corporate growth and shareholder value.
📊 Balance Sheet & Leverage Analysis
Baker Hughes’ financial structure impacts its risk profile and capacity for future dividend payments.
| Year | 2025 | 2024 | 2023 |
|---|---|---|---|
| Debt-to-Equity | 37.93 % | 35.65 % | 39.18 % |
| Debt-to-Assets | 17.48 % | 15.70 % | 16.30 % |
| Debt-to-Capital | 27.50 % | 26.28 % | 28.15 % |
| Net Debt to EBITDA | 0.80 | 0.58 | 0.85 |
| Current Ratio | 1.36 | 1.32 | 1.25 |
| Quick Ratio | 1.00 | 0.94 | 0.86 |
| Financial Leverage | 217.06 % | 227.07 % | 240.40 % |
The stable debt metrics suggest robust financial leverage moderation, allowing for liquidity management and flexibility in strategic investments.
✅ Fundamental Strength & Profitability
Key profitability ratios attest to Baker Hughes’s operational efficiency and effectiveness at generating returns for investors.
| Year | 2025 | 2024 | 2023 |
|---|---|---|---|
| Return on Equity | 13.74 % | 17.63 % | 12.64 % |
| Return on Assets | 6.33 % | 7.77 % | 5.26 % |
| Margins: Net | 9.33 % | 10.70 % | 7.62 % |
| Margins: EBIT | 11.17 % | 12.44 % | 11.25 % |
| Margins: EBITDA | 15.46 % | 16.53 % | 15.52 % |
| Margins: Gross | 23.60 % | 20.99 % | 20.59 % |
| Research & Development to Revenue | 2.16 % | 2.31 % | 0.00 % |
These profitability indicators reflect Baker Hughes's capacity to yield substantial returns and continually invest in its future growth.
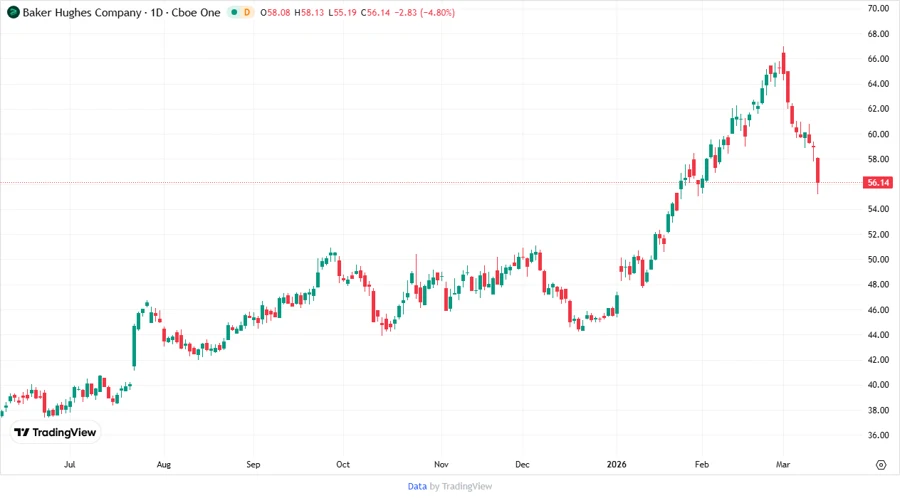
📊 Price Development
📊 Dividend Scoring System
| Category | Score | |
|---|---|---|
| Dividend yield | 3 | |
| Dividend Stability | 5 | |
| Dividend growth | 4 | |
| Payout ratio | 4 | |
| Financial stability | 4 | |
| Dividend continuity | 5 | |
| Cashflow Coverage | 3 | |
| Balance Sheet Quality | 4 |
Total Score: 32/40
🗣️ Rating
Baker Hughes Company exhibits a robust dividend profile underscored by its long-standing commitment to shareholder returns and financial prudence. With moderate growth, stable payout practices, and solid financial health, it represents a sound choice for income-seeking investors looking for consistent returns in the energy sector.
Smart Data Insight
Master the Perfect Entry & Exit for this Stock
Don't leave your profits to chance. Historically, this stock follows specific seasonal patterns that institutional traders use to maximize returns.
- ✅ Identify the "Golden Buying Window"
- ✅ Avoid high-risk correction cycles
- ✅ Backtested data from the last 20+ years