March 12, 2026 a 03:12 pm


Financial Stocks - Performance Analysis
The financial sector has experienced significant volatility over recent weeks, with a general downward trend indicated by some of the largest financial stocks. This analysis provides insights into the performance of key stocks over different time horizons: one week, one month, and three months. The analysis identifies leading performers and those lagging behind, providing valuable insight for investors seeking to understand market dynamics. 📊
Financial Stocks Performance One Week 📅
Over the last week, the financial sector witnessed notable declines across major stocks. Wells Fargo (WFC) led the decline with a substantial drop of 6.52%, highlighting sector-wide pressures. In contrast, American Express (AXP) showed resilience with a minimal decline of just 0.35%. This indicates cautious investor sentiment towards financial equities in the short term.
| Stock | Performance (%) | Performance |
|---|---|---|
| AXP | -0.35% | |
| BRK.B | -1.38% | |
| GS | -1.39% | |
| JPM | -2.07% | |
| BAC | -2.57% | |
| VISA | -3.40% | |
| MA | -3.98% | |
| PGR | -4.48% | |
| SPGI | -4.99% | |
| WFC | -6.52% |
Financial Stocks Performance One Month 📆
Over the past month, the disparities in performance are more pronounced. The S&P Global Inc. (SPGI) emerged as the sole positive performer with a 7.07% increase, indicating investor confidence in its market position. On the downside, Wells Fargo (WFC) and American Express (AXP) suffered from significant losses, dropping by 17.33% and 16.30% respectively. This suggests a cautious approach by investors following economic uncertainties impacting the broader financial climate.
| Stock | Performance (%) | Performance |
|---|---|---|
| SPGI | 7.07% | |
| PGR | -0.44% | |
| BRK.B | -1.16% | |
| VISA | -5.79% | |
| MA | -6.66% | |
| JPM | -9.89% | |
| GS | -13.54% | |
| BAC | -12.85% | |
| AXP | -16.30% | |
| WFC | -17.33% |
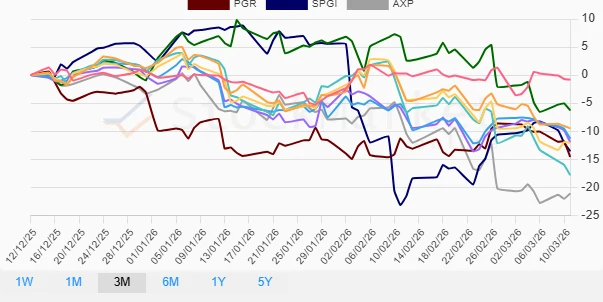
Financial Stocks Performance Three Months 📈
The quarterly analysis continues to reveal substantive losses across the financial sector. American Express (AXP) suffered the most with a decline of 21.10%, followed closely by Wells Fargo (WFC) with a drop of 17.80%. These negative performances mirror the trepidation in financial markets resulting from broader economic pressures and potential policy shifts. S&P Global Inc. (SPGI) and Goldman Sachs (GS) have shown relative stability compared to other major stocks.
| Stock | Performance (%) | Performance |
|---|---|---|
| BRK.B | -0.81% | |
| GS | -6.26% | |
| JPM | -9.48% | |
| VISA | -11.30% | |
| MA | -11.93% | |
| SPGI | -13.53% | |
| BAC | -12.04% | |
| PGR | -14.56% | |
| WFC | -17.80% | |
| AXP | -21.10% |
Summary 🗣️
The current analysis of financial stocks underlines the persistent challenges facing the sector. Despite some positive outliers like S&P Global Inc., the overarching trend suggests investors are wary, likely due to underlying economic fluctuations and policy forecasts impacting financial markets. Short-term negative performances seem to align with broader market corrections, suggesting that stakeholders should consider cautious positioning while monitoring macroeconomic indicators closely. As the market sentiment remains tentative, strategic asset allocation and a focus on stability could prove beneficial.