March 12, 2026 a 07:46 am


HPQ: Dividend Analysis - HP Inc.
HP Inc. boasts a strong dividend history of 57 years without major suspensions, indicating robust stability. Their dividend yield of 6.39% is attractive, especially in an era of low-interest rates. However, relatively modest recent growth in 3-year and 5-year horizons highlights the necessity for cautious optimism, balancing between yield and growth potential.
📊 Overview
HP Inc. operates in a diversified industrial sector with a significant dividend yield of 6.39%. Its current dividend per share stands at 1.15 USD, backed by an impressive 57-year dividend history. Notably, the firm hasn't faced any recent cuts or suspensions.
| Metric | Value |
|---|---|
| Sector | Diversified Technology and Manufacturing |
| Dividend Yield | 6.39% |
| Current Dividend Per Share | 1.15 USD |
| Dividend History | 57 years |
| Last Cut or Suspension | None |
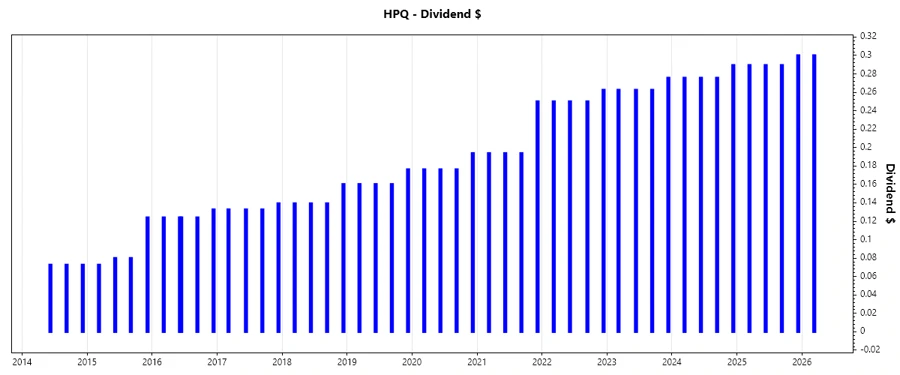
📉 Dividend History
This section examines HP Inc.'s recent dividend payments, highlighting the stability and changes over time. Understanding the historical dividend trajectory helps evaluate consistency and investor remuneration policies.
| Year | Dividend Per Share |
|---|---|
| 2026 | 0.30 USD |
| 2025 | 1.1682 USD |
| 2024 | 1.1162 USD |
| 2023 | 1.0631 USD |
| 2022 | 1.0125 USD |
📈 Dividend Growth
HP Inc.'s dividend growth over recent years showcases continuous appreciation albeit with moderate upticks. This segment is crucial for understanding the sustainability of returns through shareholder-friendly policies.
| Time | Growth |
|---|---|
| 3 years | 4.88% |
| 5 years | 10.09% |
The average dividend growth is 10.09% over 5 years. This shows moderate but steady dividend growth, underpinning a conservative strategy towards capital reinvestment and reward to shareholders.
💼 Payout Ratio
The payout ratio reflects HP Inc.’s dividend payments as a proportion of its earnings and free cash flow, showcasing the sustainability of its dividend policy.
| Key Figure | Ratio |
|---|---|
| EPS-based | 42.45% |
| Free cash flow-based | 36.68% |
With an EPS-based payout ratio of 42.45% and FCF-based at 36.68%, HP Inc. displays a healthy dividend payout infrastructure, balancing reinvestment with shareholder distribution.
💲 Cashflow & Capital Efficiency
Analyzing cash flow and capital efficiency offers insights into operational prowess and resource utilization, instrumental in sustaining dividends and fueling growth.
| Metric | 2025 | 2024 | 2023 |
|---|---|---|---|
| Free Cash Flow Yield | 10.70% | 9.08% | 11.34% |
| Earnings Yield | 9.66% | 7.98% | 12.49% |
| CAPEX to Operating Cash Flow | 24.26% | 15.79% | 17.05% |
| Stock-based Compensation to Revenue | 0.94% | 0.84% | 0.82% |
| Free Cash Flow / Operating Cash Flow Ratio | 75.74% | 84.21% | 82.95% |
The Free Cash Flow yield and Earnings yield indicate strong cash-generating capabilities, crucial for sustainable dividends and investments in future growth.
⚖️ Balance Sheet & Leverage Analysis
HP Inc.'s balance sheet analysis highlights its financial leverage, debt management, and liquidity position, crucial for evaluating creditworthiness and resilience.
| Metric | 2025 | 2024 | 2023 |
|---|---|---|---|
| Debt-to-Equity | -31.45% | -8.24% | -10.05% |
| Debt-to-Assets | 26.05% | 27.31% | 29.02% |
| Debt-to-Capital | 103.28% | 113.82% | 111.05% |
| Net Debt to EBITDA | 1.76 | 1.62 | 1.71 |
| Current Ratio | 0.77 | 0.72 | 0.73 |
| Quick Ratio | 0.48 | 0.45 | 0.45 |
| Financial Leverage | -120.72 | -30.17 | -34.62 |
HP Inc.'s analysis reveals high leverage with notable exposure to short-term liabilities. The focus should be on improving liquidity measures to enhance stability.
🧾 Fundamental Strength & Profitability
Exploring key profitability metrics, one assesses the company’s efficiency in generating earnings relative to its revenue, assets, and shareholders' equity.
| Metric | 2025 | 2024 | 2023 |
|---|---|---|---|
| Return on Equity | -7.31% | -2.10% | -3.05% |
| Return on Assets | 6.05% | 6.95% | 8.82% |
| Margins: Net | 4.57% | 5.18% | 6.07% |
| Margins: EBIT | 5.74% | 7.26% | 6.74% |
| Margins: EBITDA | 7.40% | 8.81% | 8.32% |
| Margins: Gross | 19.98% | 22.07% | 21.42% |
| R&D to Revenue | 2.90% | 3.06% | 2.94% |
Despite challenges in achieving positive ROE, HP Inc. maintains reasonable operational efficiency reflected in stable margins, yet profitability requires strategic improvements.
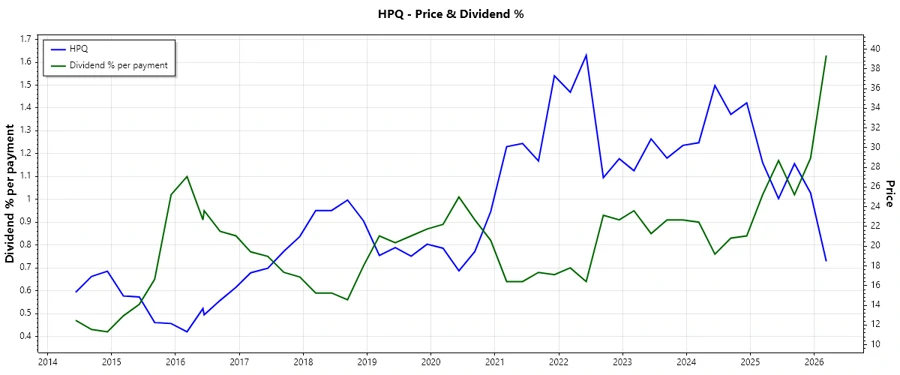
📈 Price Development
🎯 Dividend Scoring System
| Criterion | Rating | Score |
|---|---|---|
| Dividend Yield | 5 | |
| Dividend Stability | 4 | |
| Dividend Growth | 3 | |
| Payout Ratio | 4 | |
| Financial Stability | 3 | |
| Dividend Continuity | 5 | |
| Cashflow Coverage | 3 | |
| Balance Sheet Quality | 2 |
Overall Score: 29/40
✅ Rating
HP Inc. emerges as a viable candidate for dividend investors due to its stellar yield and extensive dividend history. Although some metrics reflect potential vulnerabilities, particularly in leverage and growth strategies, the overall profile suggests hp's commitment to delivering shareholder value. Cautious optimism is warranted, focusing on monitoring financial health and strategic execution continuously.
Smart Data Insight
Master the Perfect Entry & Exit for this Stock
Don't leave your profits to chance. Historically, this stock follows specific seasonal patterns that institutional traders use to maximize returns.
- ✅ Identify the "Golden Buying Window"
- ✅ Avoid high-risk correction cycles
- ✅ Backtested data from the last 20+ years