March 12, 2026 a 04:03 am

URI: Trend and Support & Resistance Analysis - United Rentals, Inc.
United Rentals, Inc. (URI) has been experiencing fluctuating stock prices over the last few months. Its price movement is influenced by macroeconomic factors as well as company-specific developments. With a diverse range of products and services, United Rentals serves crucial industries, from construction to municipal services.
Trend Analysis
Based on the EMA indicators calculated from the closing prices, the recent trend for United Rentals, Inc. stock is as follows:
| Date | Closing Price | Trend |
|---|---|---|
| 2026-03-11 | 780.57 | ▼ |
| 2026-03-10 | 775.79 | ▼ |
| 2026-03-09 | 820.68 | ▲ |
| 2026-03-06 | 809.60 | ▲ |
| 2026-03-05 | 842.93 | ▲ |
| 2026-03-04 | 851.88 | ▲ |
| 2026-03-03 | 833.47 | ▲ |
The current trend indicates a transition from a brief upward direction turning downwards, suggesting that the price is facing resistance at higher levels.
Support- and Resistance
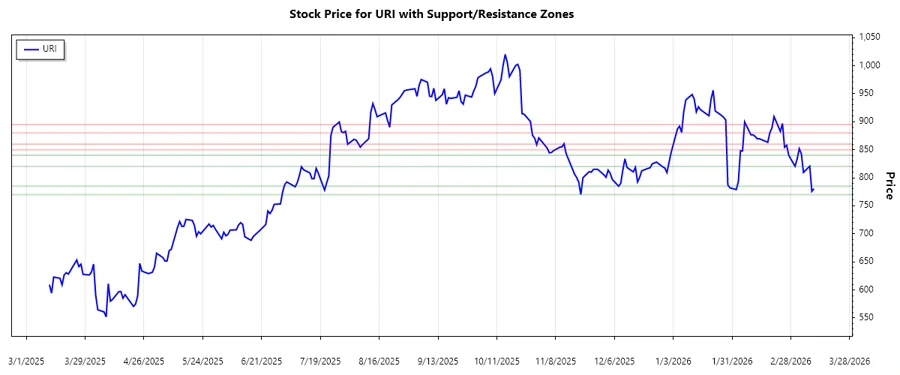
By analyzing the historical price data, key support and resistance zones have been identified:
| Zone Type | From | To |
|---|---|---|
| Support | 770 | 785 |
| Support | 820 | 840 |
| Resistance | 850 | 860 |
| Resistance | 880 | 895 |
The current price appears to be within the lower support zone, providing a cushion against further declines.
Conclusion
The overall trend for United Rentals, Inc. shows signs of bearish pressure, yet the stock is holding above critical support levels. If the price manages to break through the resistance zones, there could be a shift in momentum presenting opportunities to investors. However, failing to sustain the current support zones could pose downside risks. Investors should monitor economic indicators and sector-specific developments impacting the company. Analysts should be attentive to upcoming earnings reports and market conditions, as these could trigger volatility in the stock's price movement.