March 12, 2026 a 12:46 pm


SPGI: Dividend Analysis - S&P Global Inc.
S&P Global Inc. presents a robust dividend profile with a legacy of 42 years without significant interruptions. Despite a lower yield of 0.91%, its stability and consistent growth reflect reliability. Market observers appreciate its careful balance between reinvestment and rewarding shareholders.
📊 Overview
S&P Global Inc. operates within the financial sector, offering a dividend yield of 0.91% with a steady historical growth trajectory over 42 years without any cuts or suspensions. This commitment to consistent payouts underscores its credibility.
| Sector | Dividend Yield | Current Dividend Per Share | Dividend History | Last Cut/Suspension |
|---|---|---|---|---|
| Financial | 0.91% | $3.84 | 42 years | None |
📈 Dividend History
The dividend history of S&P Global Inc. is a cornerstone of its financial strategy, providing a signal of its fiscal health and reliability. Historical consistency often attracts long-term investors seeking stable returns.
| Year | Dividend Per Share (USD) |
|---|---|
| 2026 | 0.97 |
| 2025 | 3.84 |
| 2024 | 3.64 |
| 2023 | 3.60 |
| 2022 | 3.32 |
📈 Dividend Growth
Examining dividend growth offers insights into the company's future earnings potential and its commitment to return value to shareholders. Growth over time indicates financial resilience and management effectiveness.
| Time | Growth |
|---|---|
| 3 years | 4.97% |
| 5 years | 7.46% |
The average dividend growth is 7.46% over 5 years. This shows moderate but steady dividend growth.
✅ Payout Ratio
The payout ratio is crucial for assessing if dividend payouts are sustainable. A lower ratio suggests that the company retains enough earnings for other ventures.
| Key figure | Ratio |
|---|---|
| EPS-based | 25.91% |
| Free cash flow-based | 21.30% |
Both the EPS-based (25.91%) and the FCF-based (21.30%) payout ratios indicate a healthy margin, pointing to S&P Global Inc.'s strategic allocation of earnings without stretching its payouts.
💰 Cashflow & Capital Efficiency
Analysis of cash flows and capital efficiency provides insights into the operational effectiveness and the intelligent use of resources to generate value beyond immediate dividends.
| Year | 2023 | 2024 | 2025 |
|---|---|---|---|
| Free Cash Flow Yield | 2.54% | 3.59% | 3.43% |
| Earnings Yield | 1.87% | 2.48% | 2.81% |
| CAPEX to Operating Cash Flow | 3.85% | 2.18% | 3.45% |
| Stock-based Compensation to Revenue | 1.37% | 1.74% | 1.54% |
| Free Cash Flow / Operating Cash Flow Ratio | 96.15% | 97.82% | 96.55% |
The figures reflect robust cash flow generation and efficient capital deployment, further contributing to the long-term reliability of its dividend policy.
⚖️ Balance Sheet & Leverage Analysis
Understanding the balance sheet strength and leverage offers a picture of the company’s financial risks and potential for future growth.
| Year | 2023 | 2024 | 2025 |
|---|---|---|---|
| Debt-to-Equity | 0.35 | 0.36 | 0.45 |
| Debt-to-Assets | 0.20 | 0.20 | 0.23 |
| Debt-to-Capital | 0.26 | 0.26 | 0.31 |
| Net Debt to EBITDA | 2.08 | 1.51 | 1.62 |
| Current Ratio | 0.84 | 0.85 | 0.82 |
| Quick Ratio | 0.84 | 0.85 | 0.82 |
| Financial Leverage | 1.77 | 1.82 | 1.96 |
The balance indicates moderate leverage, with slight fluctuations in ratios, signifying controlled expansion and a sound risk management approach.
💪 Fundamental Strength & Profitability
Profitability metrics serve as indicators of economic value generation and efficiency in using assets to yield profits.
| Year | 2023 | 2024 | 2025 |
|---|---|---|---|
| Return on Equity | 7.68% | 11.62% | 14.31% |
| Return on Assets | 4.33% | 6.40% | 7.31% |
| Margins: Net | 21.01% | 27.11% | 29.15% |
| Margins: EBIT | 32.05% | 39.45% | 42.48% |
| Margins: EBITDA | 41.19% | 47.71% | 50.16% |
| Margins: Gross | 66.86% | 69.09% | 70.25% |
| R&D to Revenue | 0% | 0% | 0% |
With solid margins and returns, S&P Global Inc. exemplifies operational prowess, turning consistent profit margins that promise attractive shareholder returns.
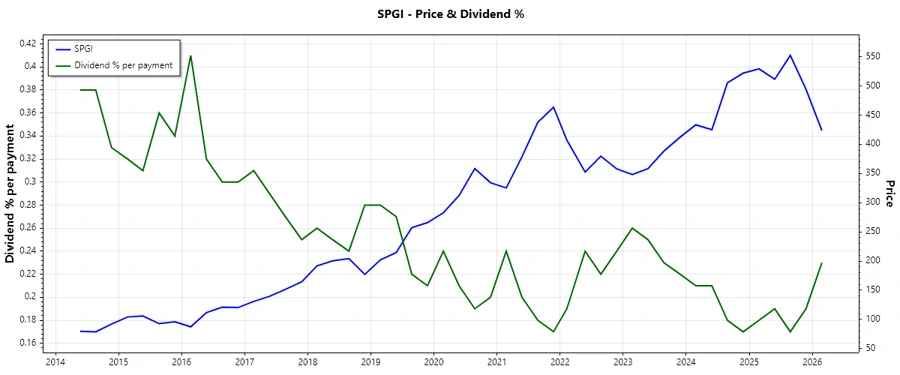
Price Development
🏆 Dividend Scoring System
| Category | Score (1-5) | Score Bar |
|---|---|---|
| Dividend Yield | 3 | |
| Dividend Stability | 5 | |
| Dividend Growth | 4 | |
| Payout Ratio | 4 | |
| Financial Stability | 4 | |
| Dividend Continuity | 5 | |
| Cashflow Coverage | 4 | |
| Balance Sheet Quality | 4 |
Total Score: 33/40
⭐ Rating
S&P Global Inc. receives a strong recommendation for dividend-focused investors seeking stable and reliable income streams. Its solid dividend track record, balanced payout ratios, and strong fundamental metrics highlight its potential as a choice for long-term, risk-averse investors.