March 12, 2026 a 04:44 pm
BEN: Fibonacci Analysis - Franklin Resources, Inc.
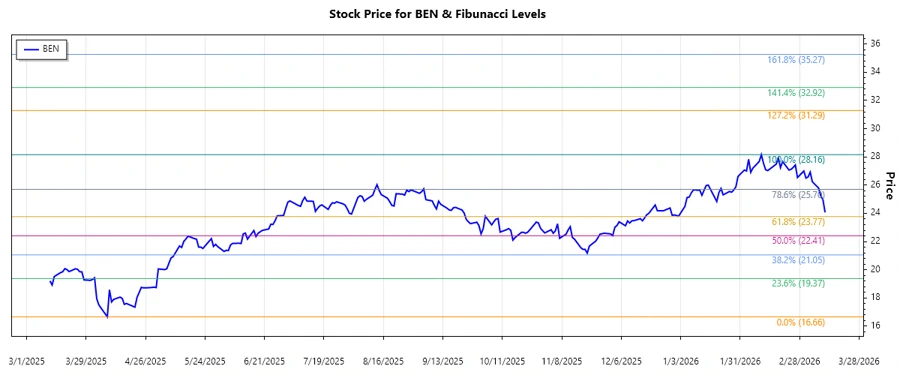
Franklin Resources, Inc. has exhibited a notable upward trend over the past months, reflecting strong performance in the asset management sector. This trend positions the company as a favorable choice for investors seeking both growth and stability. The firm’s global expansion strategies continue to enhance its market presence, offering promising long-term prospects. However, investors should remain cautious about market volatility affecting the financial sector.
Fibonacci Analysis
| Detail | Information |
|---|---|
| Analysed Trend | Upward |
| Start Date | 2025-04-08 |
| End Date | 2026-03-06 |
| High Point (Price/Date) | $28.16 on 2026-02-10 |
| Low Point (Price/Date) | $16.66 on 2025-04-08 |
| 0.236 Fibonacci Level | $19.82 |
| 0.382 Fibonacci Level | $21.72 |
| 0.5 Fibonacci Level | $22.41 |
| 0.618 Fibonacci Level | $23.11 |
| 0.786 Fibonacci Level | $24.09 |
| Current Price | $24.065 |
| In Retracement Zone | Yes, 0.786 |
The current price has entered the 0.786 retracement zone, indicating a potential support level, which could suggest a continuation of the upward trend if the price holds above this level.
Conclusion
The analysis of Franklin Resources, Inc. reveals that the recent price movements align with a predominant upward trend, enhancing its attractiveness as a growth-centric investment. The company’s expansion strategies and robust asset management offerings consolidate its market standing. Nonetheless, investors must be mindful of potential corrections, as the current price nears significant retracement levels. Overall, the stock represents a strategic addition for those seeking exposure to a resilient financial entity, supported by strong technical parameters.