March 12, 2026 a 11:44 am
CTRA: Fibonacci Analysis - Coterra Energy Inc.
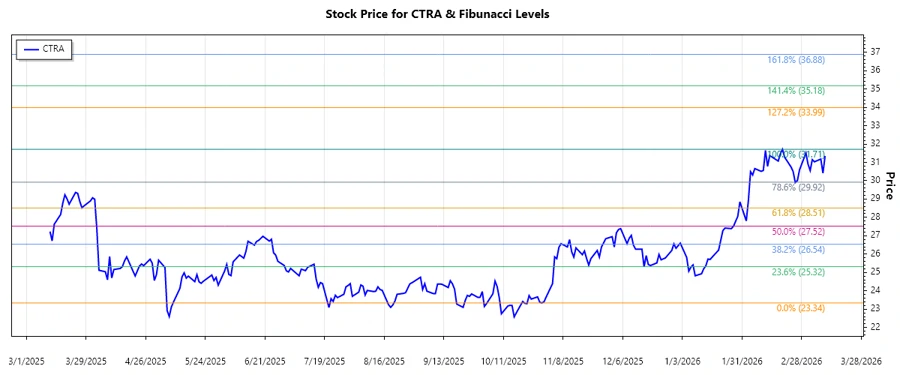
Coterra Energy Inc.'s stock has been showcasing an uptrend over the last few months, driven by its operations in the profitable oil and gas sectors across key locations in the U.S. The company's focus on areas like the Marcellus Shale has positioned it well amidst fluctuating energy prices. Through our analysis, we can identify potential support and resistance levels to guide future investment decisions.
Fibonacci Analysis
| Parameter | Value |
|---|---|
| Start Date | 2025-10-31 |
| End Date | 2026-03-11 |
| High Price (Date) | $31.71 (2026-02-19) |
| Low Price (Date) | $23.34 (2025-10-29) |
Fibonacci Levels
| Level | Price |
|---|---|
| 0.786 | $30.26 |
| 0.618 | $28.80 |
| 0.5 | $27.52 |
| 0.382 | $26.23 |
| 0.236 | $24.72 |
The current price of $31.35 indicates that the stock is above the Fibonacci retracement levels, suggesting there is no active retracement in progress. This can be interpreted as a sign of continued upward momentum, indicating potential resistance in the near-term around higher Fibonacci extensions.
Conclusion
Coterra Energy Inc. has demonstrated a robust uptrend, capitalized by its strategic resource operations across rich basins. This upward movement indicates potential growth with possible higher resistance figures to be observed. However, energy sector volatility remains a risk. Analysts should consider this momentum as a bullish signal, yet remain cautious of global market alterations and their impact on energy prices.