March 09, 2026 a 05:08 am
NZDJPY: Fibonacci Analysis
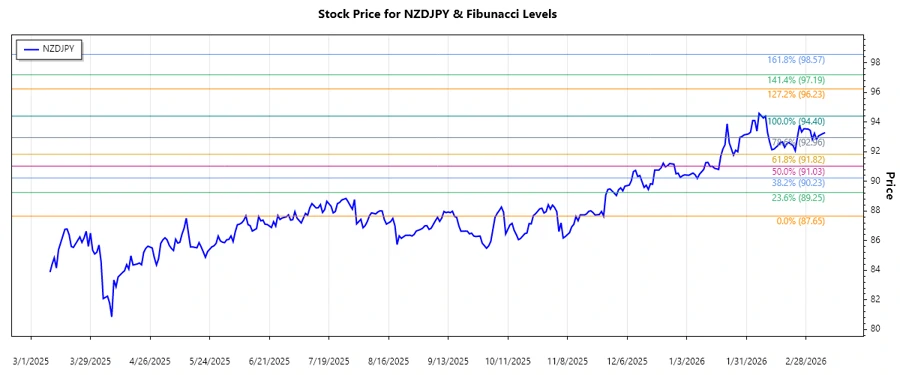
NZDJPY has shown significant price movements over the past months, characterized by a strong upward trend. While global factors affected the pair incrementally, the New Zealand dollar is showing resilience against the yen. The recent data highlights a series of higher highs and higher lows, suggesting bullish momentum could continue. However, the pair's vulnerability to geopolitical and economic developments remains a key factor to watch.
Fibonacci Analysis
The NZDJPY currency pair has exhibited a pronounced uptrend, with price action marking higher highs. Analyzing data from November 2025 to March 2026 reveals a notable upward trajectory, making it suitable for Fibonacci retracement analysis.
| Trend Analysis | Details |
|---|---|
| Start Date | 2025-11-25 |
| End Date | 2026-02-09 |
| High Point | 94.4 (2026-02-09) |
| Low Point | 87.654 (2025-11-25) |
| Fibonacci Level | Price Levels |
|---|---|
| 0.236 | 92.953 |
| 0.382 | 91.853 |
| 0.5 | 91.027 |
| 0.618 | 90.201 |
| 0.786 | 89.130 |
The current price is trading near the 0.618 Fibonacci retracement level. This indicates potential support, where the price may consolidate or bounce back upwards before continuing its trend.
This retracement analysis suggests that if the price holds above the 0.618 level, we may see further bullish movements in the medium term.
Conclusion
The NZDJPY has seen a healthy uptrend, but as with any financial instrument, it faces risks from volatile market conditions. The Fibonacci retracement levels provide potential price floors where the currency may stabilize or rebound. As analysts keep a close eye on these technical indicators, any significant breach of key levels could signal a potential reversal or further continuation of the trend. Investors should remain cautious, balancing optimism with preparedness for market fluctuations.